Stats
Actions
Available In
Tags
By gnurio
Critique and redesign data graphics using Edward Tufte's VDQI principles — score charts against a nine-criterion rubric, detect chartjunk, compute lie factor, and render publication-ready SVG/HTML charts (time-series, small multiples, quartile plots, range-frame scatter) with minimal-ink styling.
Render a real, publication-ready data graphic (SVG or HTML) that obeys Tufte's principles — minimal ink, range-frame axes, direct labels, honest proportions. Use when someone wants to design, build, create, draw, plot, or visualize a chart or graph the Tufte way, or to rebuild a chart after a critique found problems. This is the skill that outputs an actual chart file. Not for critiquing an existing graphic (`tufte-critique`).
Critique a data graphic against a nine-criterion rubric derived from Tufte's VDQI — score it, name the chartjunk species present, compute the lie factor, compare against the book's named-failure catalogue, and return prioritised fixes tagged with the Tufte remedy (B1–B7), genre to switch to (C1–C10), and exemplar to emulate. Use when someone asks whether a chart, graph, plot, or dashboard is any good; what is wrong with it; whether it is misleading or distorted; or how to clean up, declutter, or simplify it. Not for producing a chart file (`tufte-chart`).
Own this plugin?
Verify ownership to unlock analytics, metadata editing, and a verified badge. GitHub access is read-only (username + org membership).
Sign in to claimOwn this plugin?
Verify ownership to unlock analytics, metadata editing, and a verified badge. GitHub access is read-only (username + org membership).
Sign in to claimBased on adoption, maintenance, documentation, and repository signals. Not a security audit or endorsement.
Give your AI agents the skill of visualizing data the way Edward Tufte intended.
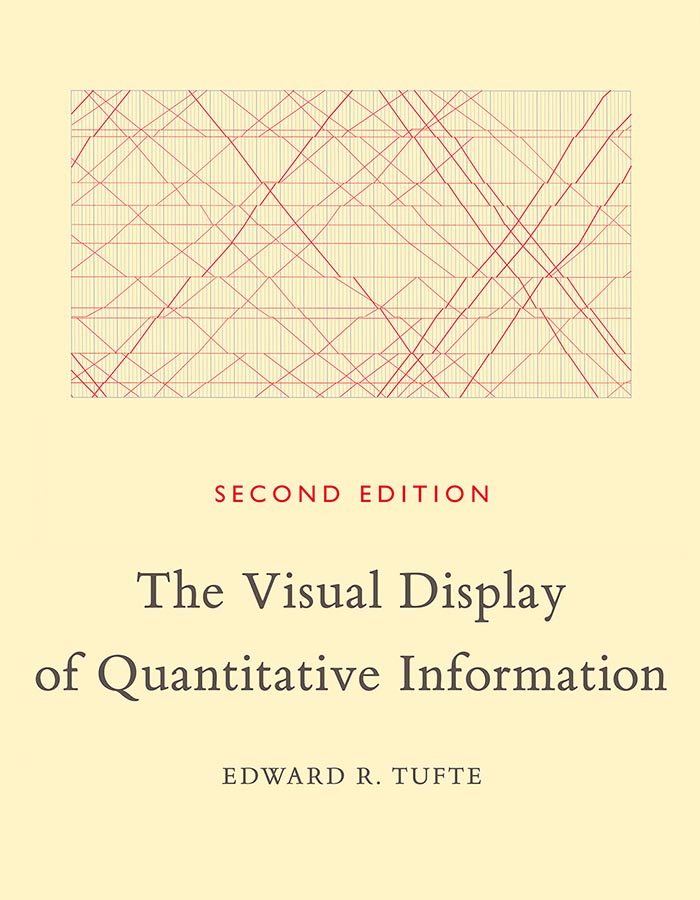
Based on Edward Tufte's The Visual Display of Quantitative Information
Every chart your agent produces gets scored against Tufte's principles — lie factor measured, chartjunk stripped, redundant ink removed, labels moved inline, axes replaced with range-frames, monetary values inflation-adjusted, and the result rendered as a clean SVG. Not as a suggestion. As a workflow.
| Before | After |
|---|---|
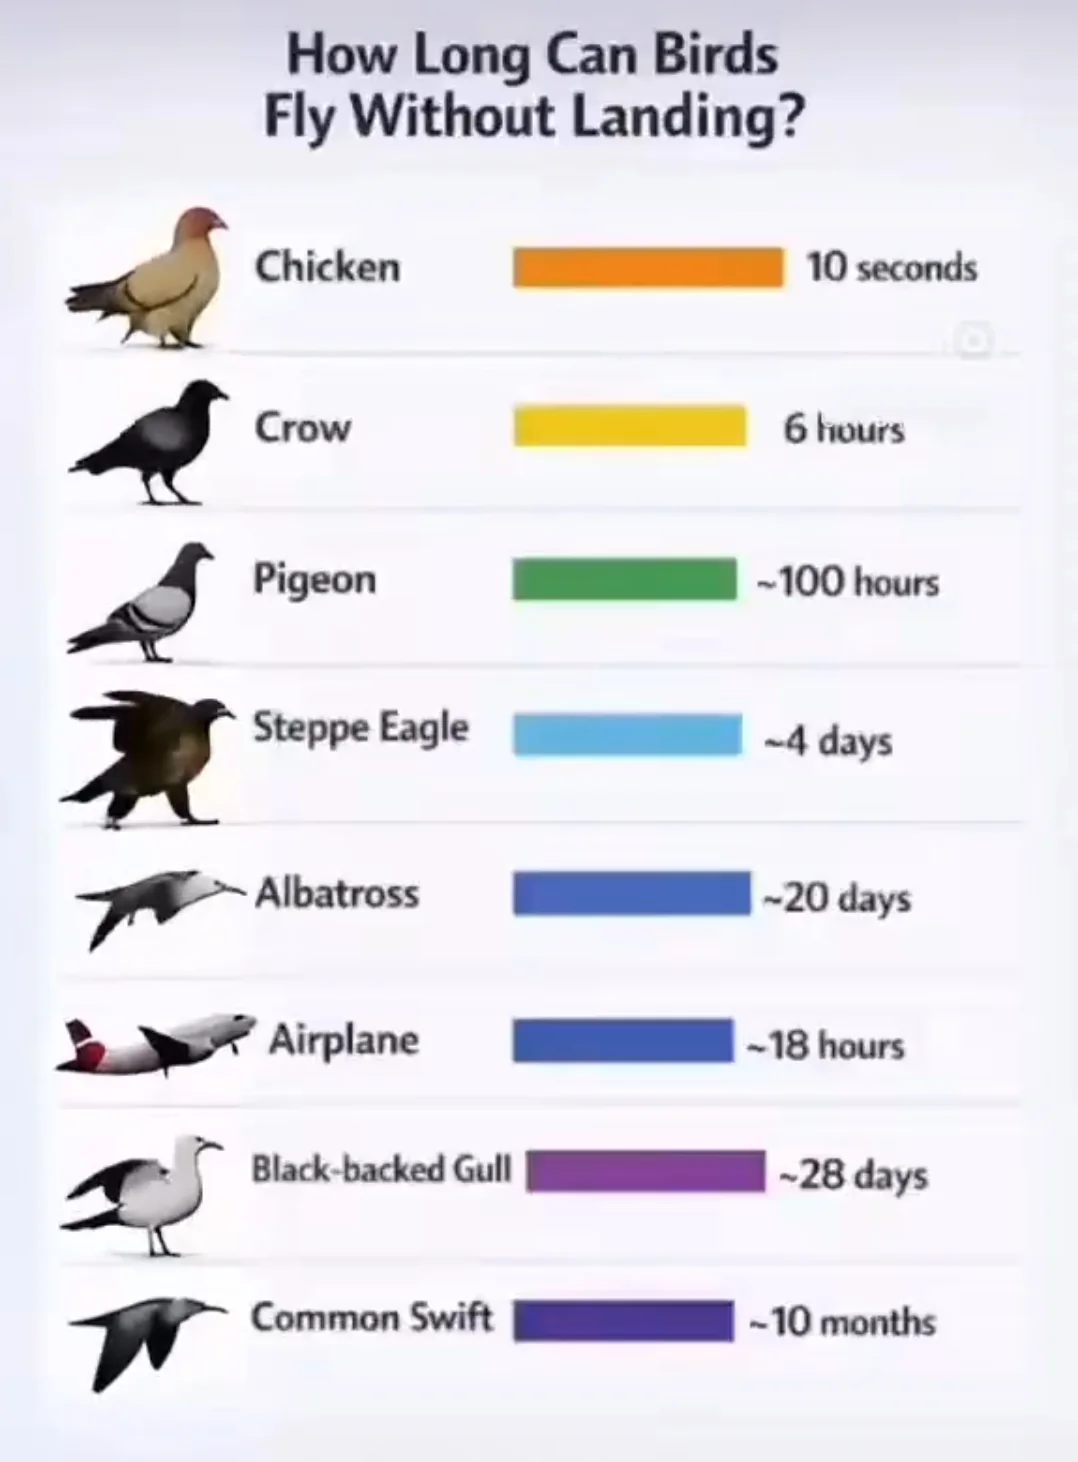 |  |
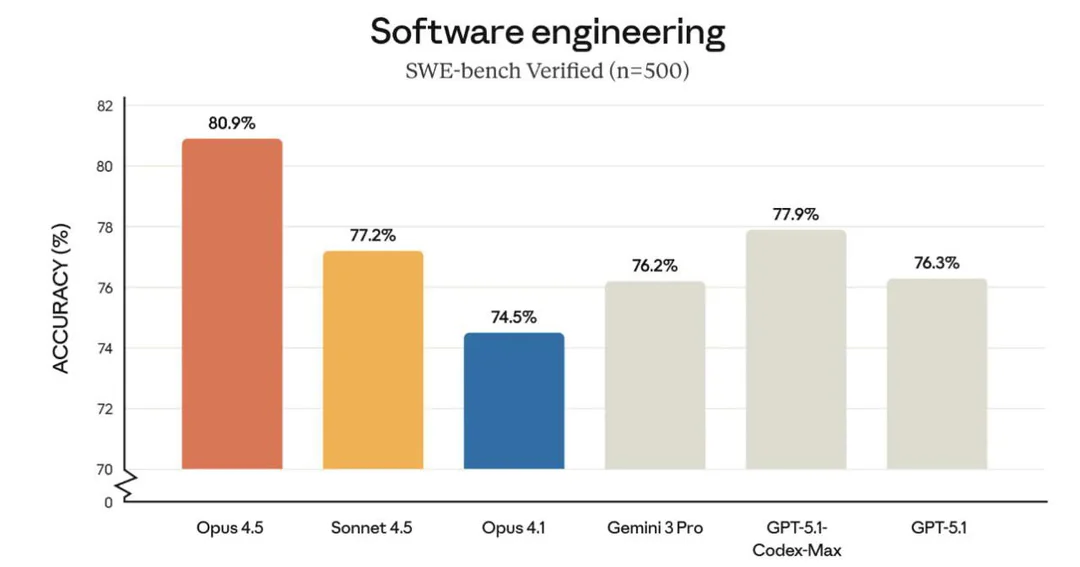 |  |
Same data, both times. No decorative bars, no arbitrary colors. Cleveland dot plots that let the actual signal — and the uncertainty — speak for itself.
The two skills follow the open SKILL.md agent-skills standard, so they work in any harness that reads it. Each skill directory is self-contained (scripts, reference, assets included) and can be installed on its own.
Claude Code — from your terminal
claude plugin marketplace add gnurio/tufte-vdqi-plugin
claude plugin install tufte-vdqi@tufte-vdqi-marketplace
Claude Code — inside a session (typed at the > prompt, not the shell)
/plugin marketplace add gnurio/tufte-vdqi-plugin
/plugin install tufte-vdqi
Claude Desktop / Cowork
Requires a paid Claude plan with Cowork enabled. Org admins: Organization Settings → Plugins → GitHub source → paste this repo URL.
Codex CLI
git clone https://github.com/gnurio/tufte-vdqi-plugin
cp -r tufte-vdqi-plugin/skills/* ~/.codex/skills/
OpenCode
git clone https://github.com/gnurio/tufte-vdqi-plugin
cp -r tufte-vdqi-plugin/skills/* ~/.config/opencode/skills/
Any other SKILL.md-compatible agent (Cursor, Gemini CLI, Copilot, …)
Copy the directories under skills/ into wherever your tool discovers skills. Scripts need only Python 3 — no dependencies.
Two skills, one VDQI-sourced reference. The principles file (mirrored into both skills so each installs standalone) is the source-grounded encoding of Tufte's specific techniques — a nine-criterion rubric with numeric anchors, ten chart genres with construction recipes, a chartjunk taxonomy, 13+14 named anti-pattern/exemplar catalogues, and the friendly-graphic checklist — all cited to VDQI by page.
| Skill | What it does |
|---|---|
tufte-critique | Scores a graphic against a nine-criterion VDQI rubric with numeric anchors, names the chartjunk species present (moiré, dreaded grid, duck, decoration), computes lie factor and compares to VDQI's catalogue (14.8 NYT MPG, 59.4 TIME barrel "a record", etc.), checks whether the data wants a different genre (table for ≤20 numbers, small multiples for many series, range frame instead of bordered scatter), and emits fixes tagged with remedy / genre / anti-pattern resemblance / exemplar to emulate. |
tufte-chart | Produces an actual SVG using Tufte's specific genres. Ships per-genre scripts for time-series, small multiples, the quartile plot (Tufte's stripped-down box plot), and range-frame scatter (with optional dot-dash marginals), plus an HTML wrapper using the bundled tufte-css. |
Ships with helper scripts and the tufte-css typography bundle (MIT, vendored under skills/tufte-chart/assets/tufte-css/):
npx claudepluginhub gnurio/tufte-vdqi-plugin --plugin tufte-vdqi12 executable skills + orchestrator for competitive strategy analysis, extracted from Michael Porter's Competitive Strategy. Five forces, competitor profiling, strategic groups, market signals, generic strategies, competitive moves, and industry-type playbooks — grounded in Porter's original frameworks.
AI-powered UI design skills based on Refactoring UI principles. Evaluate and improve interface designs with expert-validated guidance.
14 skills for idea spread, cultural transmission, and strategic communication — based on Memetics 101.
AntV visualization skills for transforming data into clear, interactive charts and graphs for data-driven insights.
Generate publication-quality academic diagrams, statistical plots, and presentation slides using PaperBanana multi-agent framework
Publication-quality matplotlib/seaborn charts with opinionated aesthetics
Create beautiful, self-contained HTML visualizations from any content or idea. Use for slide decks, dashboards, infographics, flowcharts, timelines, cheat sheets, posters, and more.
Author grammar-of-graphics plots with the gribouille Typst library.
An Infographic Generation and Rendering Framework, bring words to life!
'%20stop-opacity%3D'0.16'%2F%3E%3Cstop%20offset%3D'1'%20stop-color%3D'rgb(200%2C90%2C60)'%20stop-opacity%3D'0.03'%2F%3E%3C%2FlinearGradient%3E%3C%2Fdefs%3E%3Crect%20width%3D'320'%20height%3D'200'%20fill%3D'url(%23g)'%2F%3E%3Ccircle%20cx%3D'250'%20cy%3D'56'%20r%3D'92'%20fill%3D'rgb(200%2C90%2C60)'%20fill-opacity%3D'0.06'%2F%3E%3Ccircle%20cx%3D'64'%20cy%3D'172'%20r%3D'58'%20fill%3D'rgb(200%2C90%2C60)'%20fill-opacity%3D'0.05'%2F%3E%3C%2Fsvg%3E)