Stats
Actions
Available In
Tags
By tvhahn
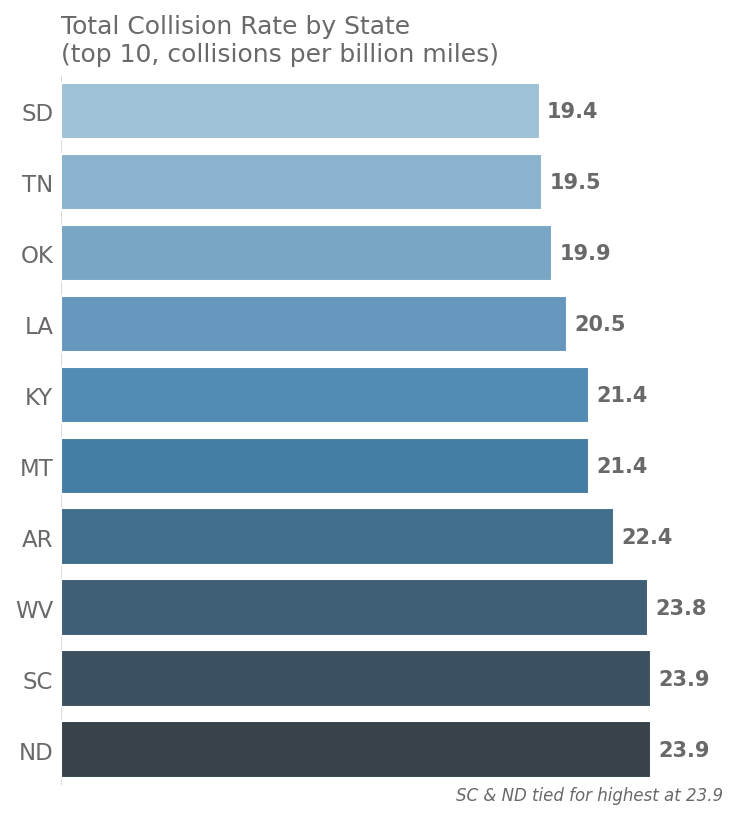
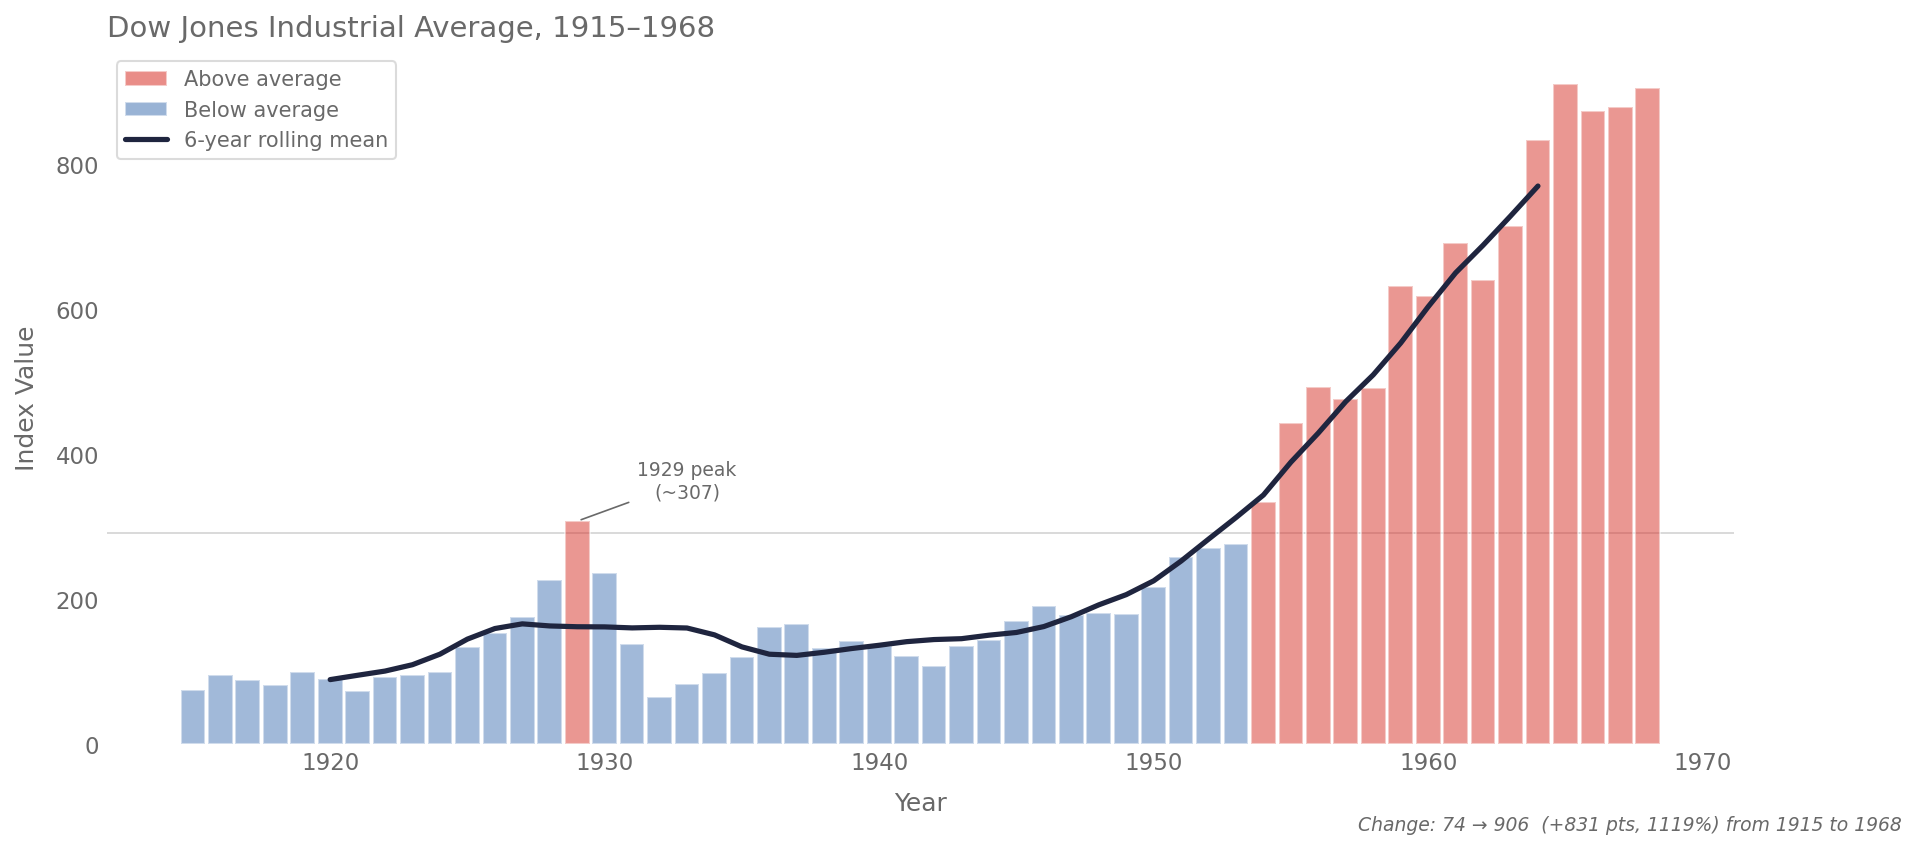
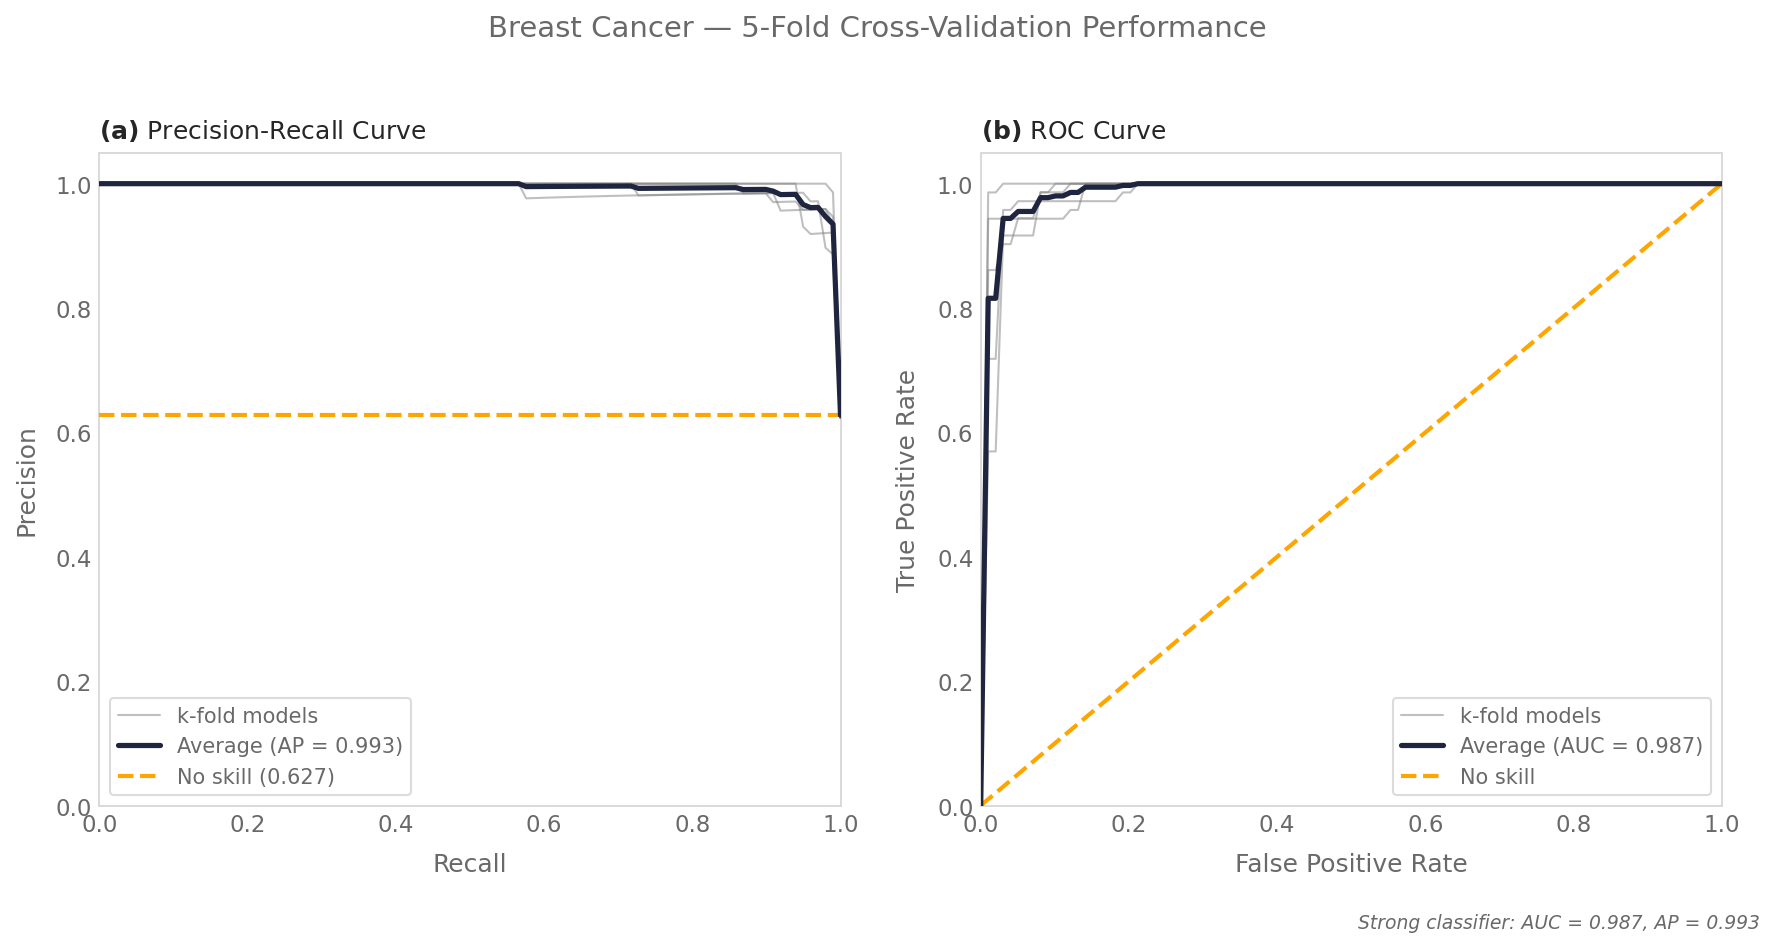
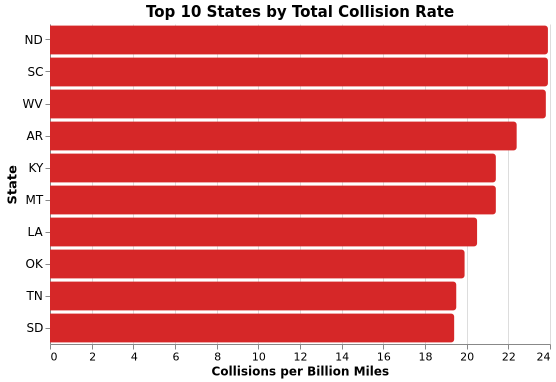
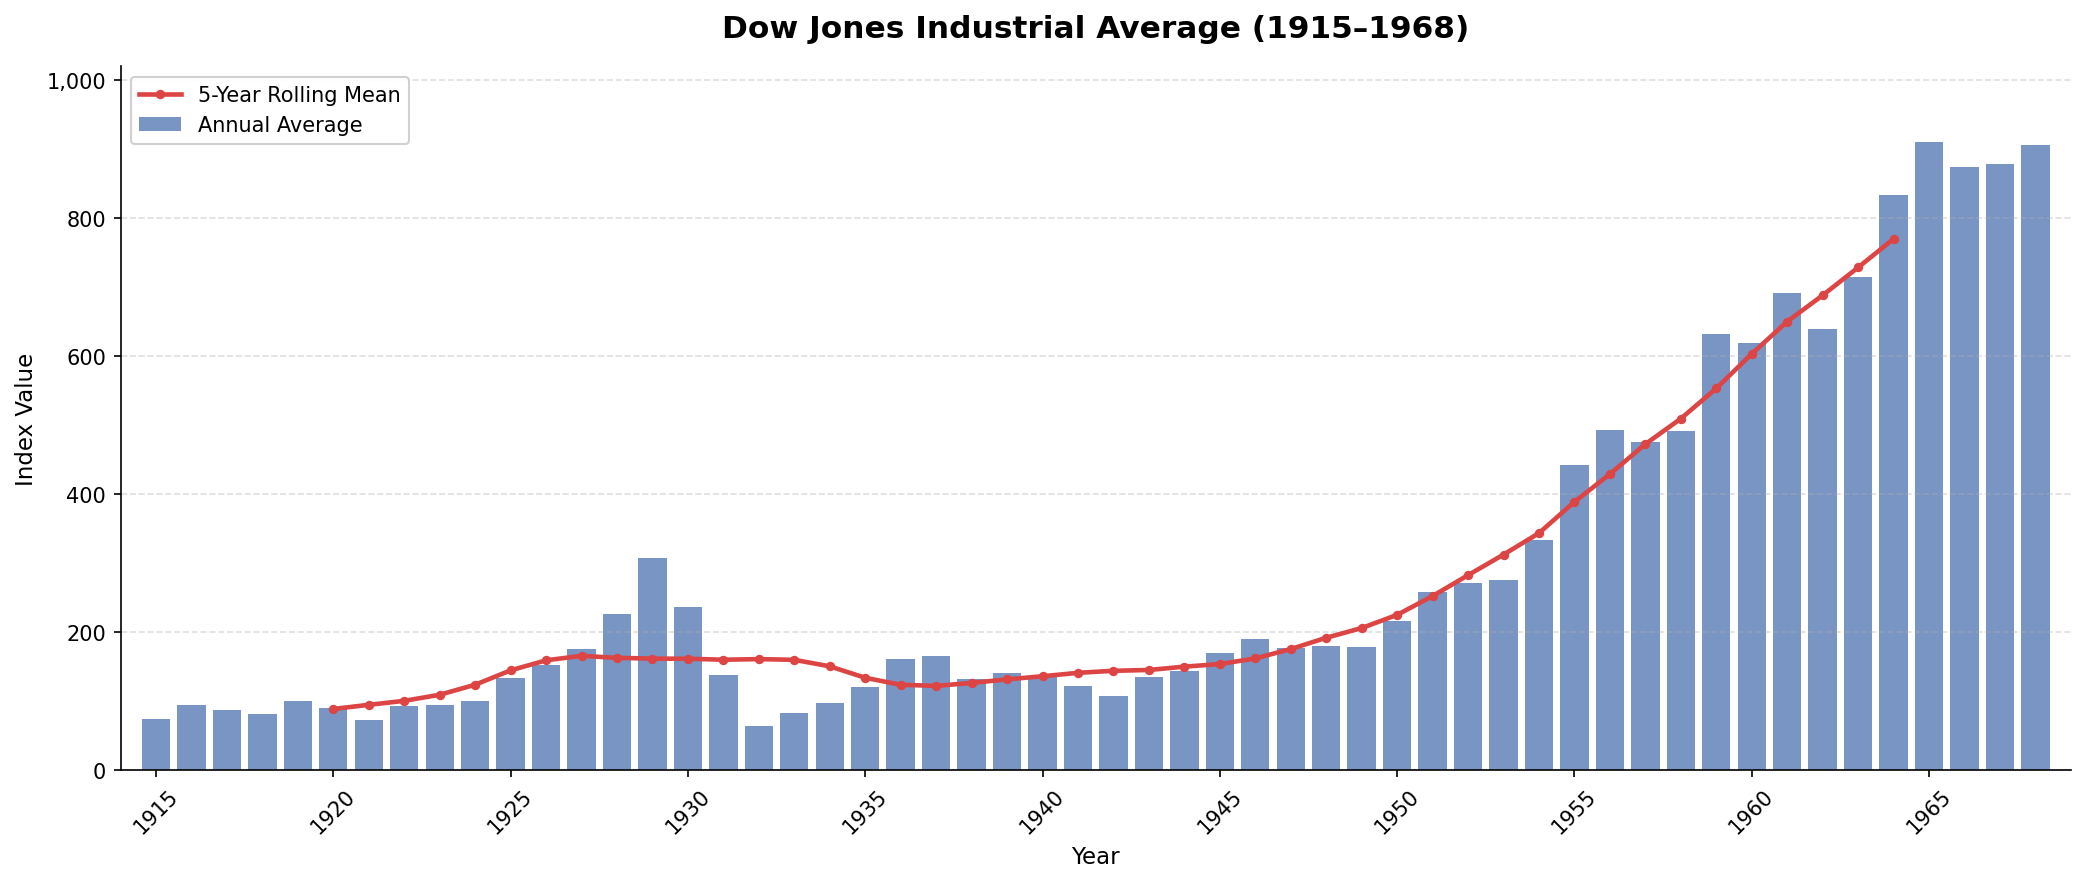
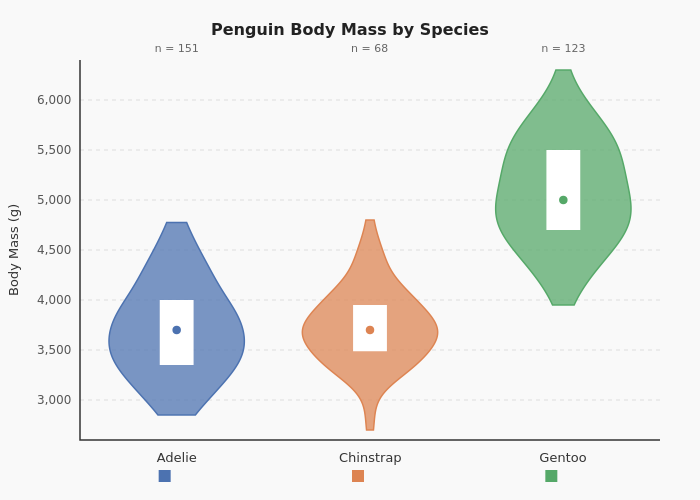
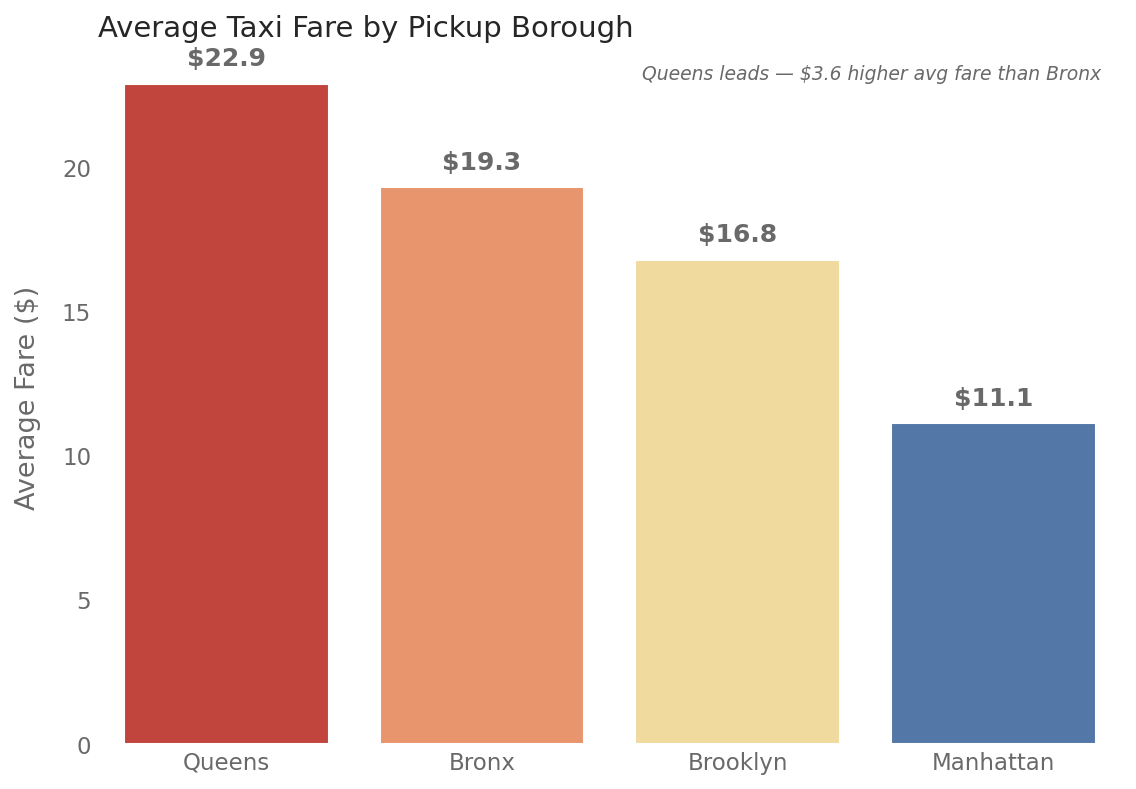
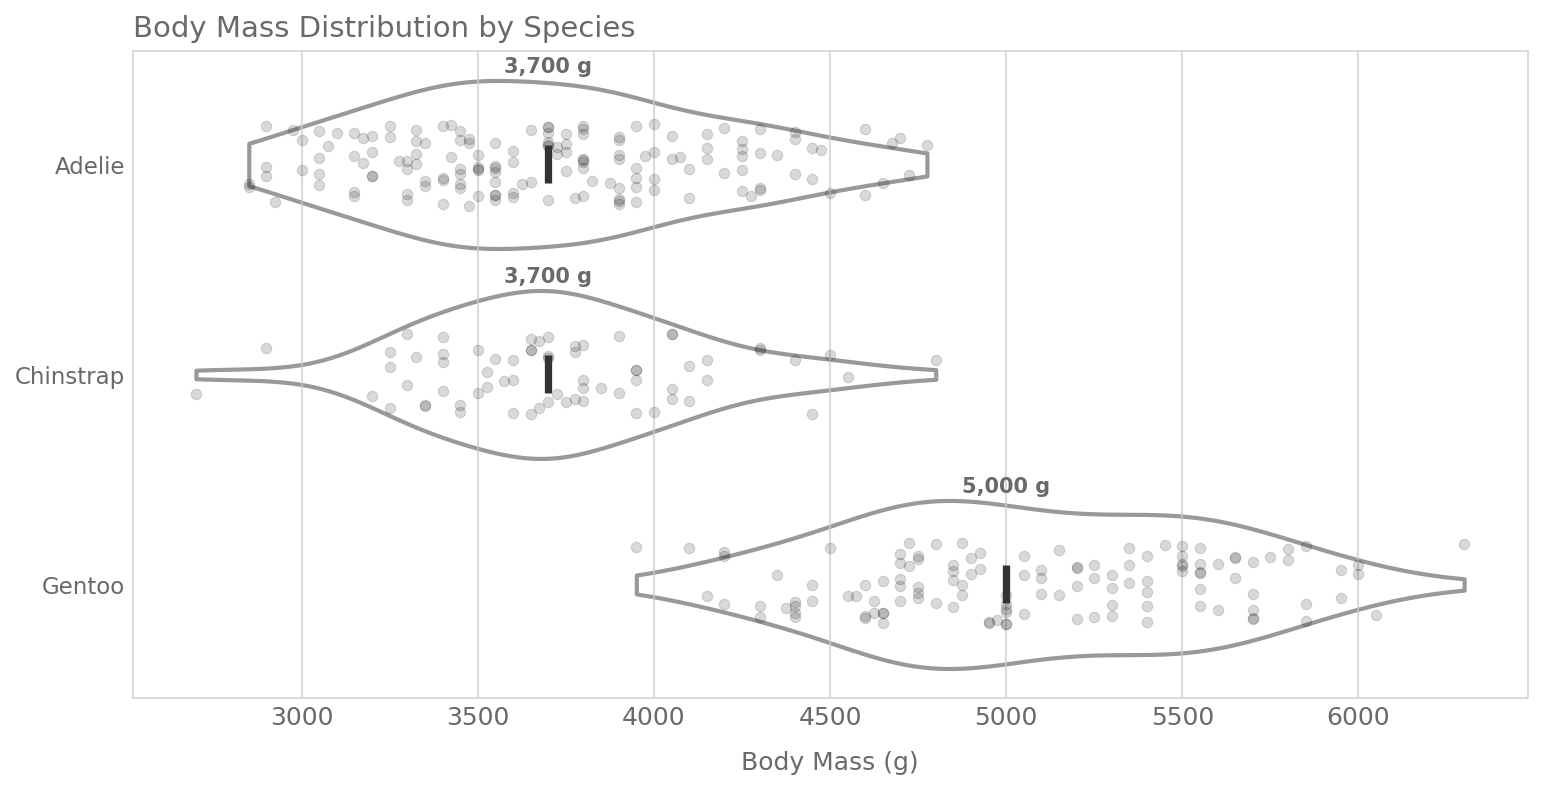
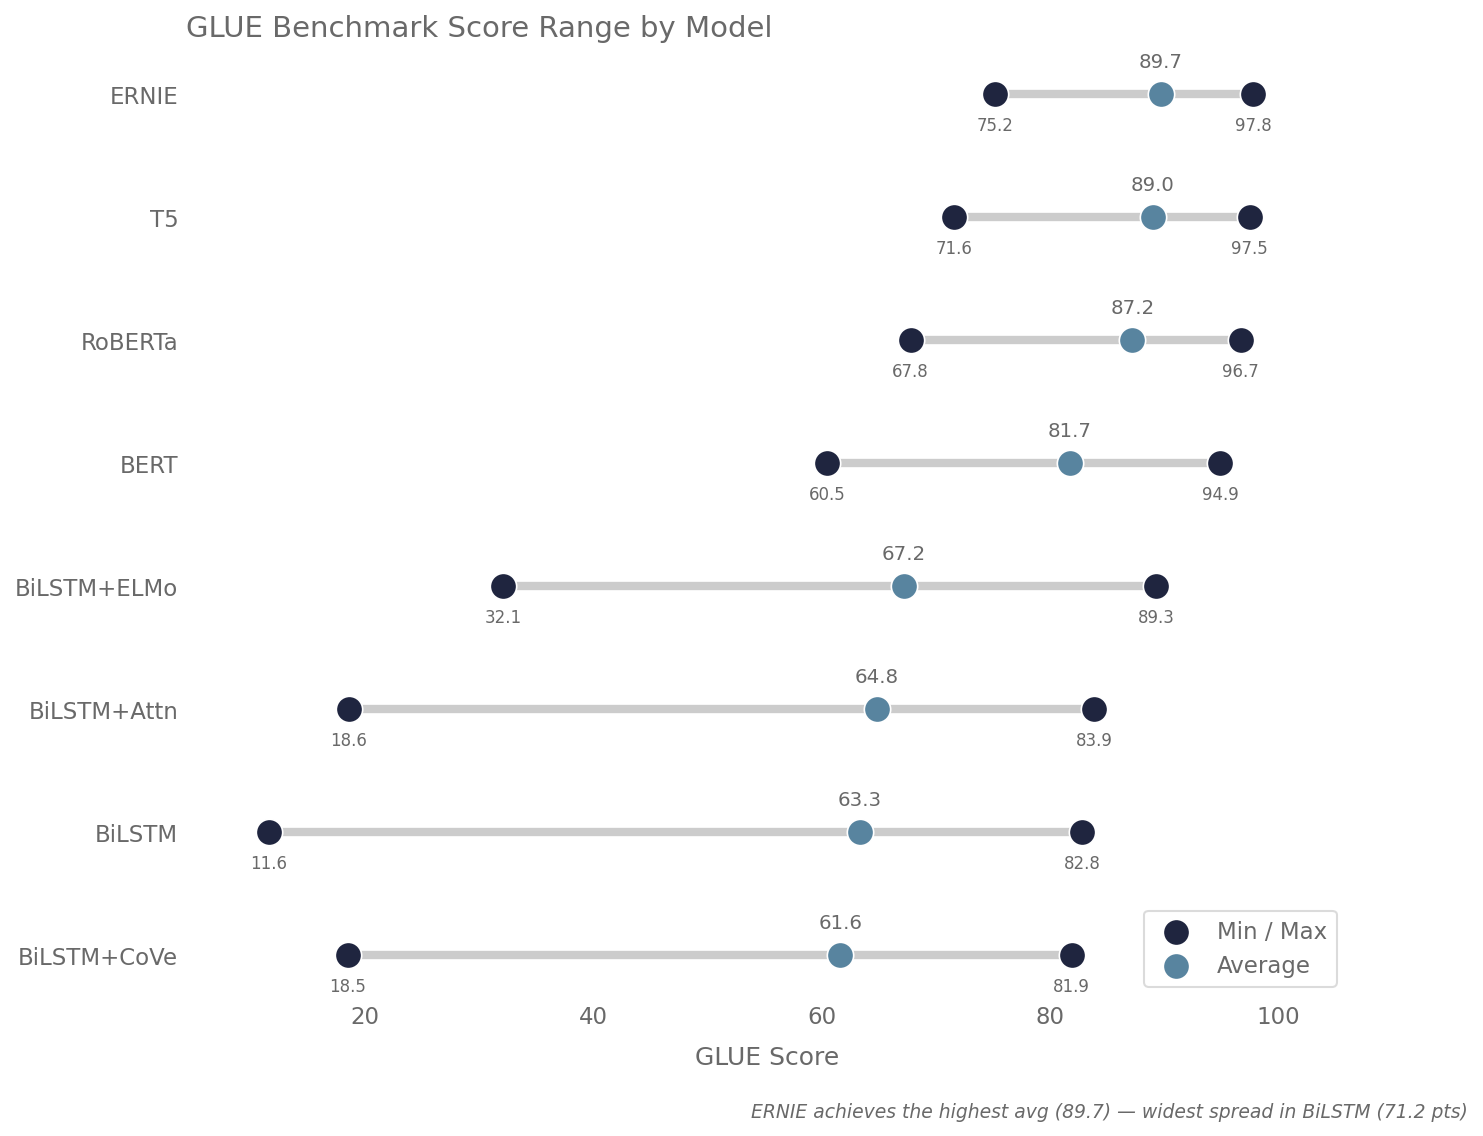
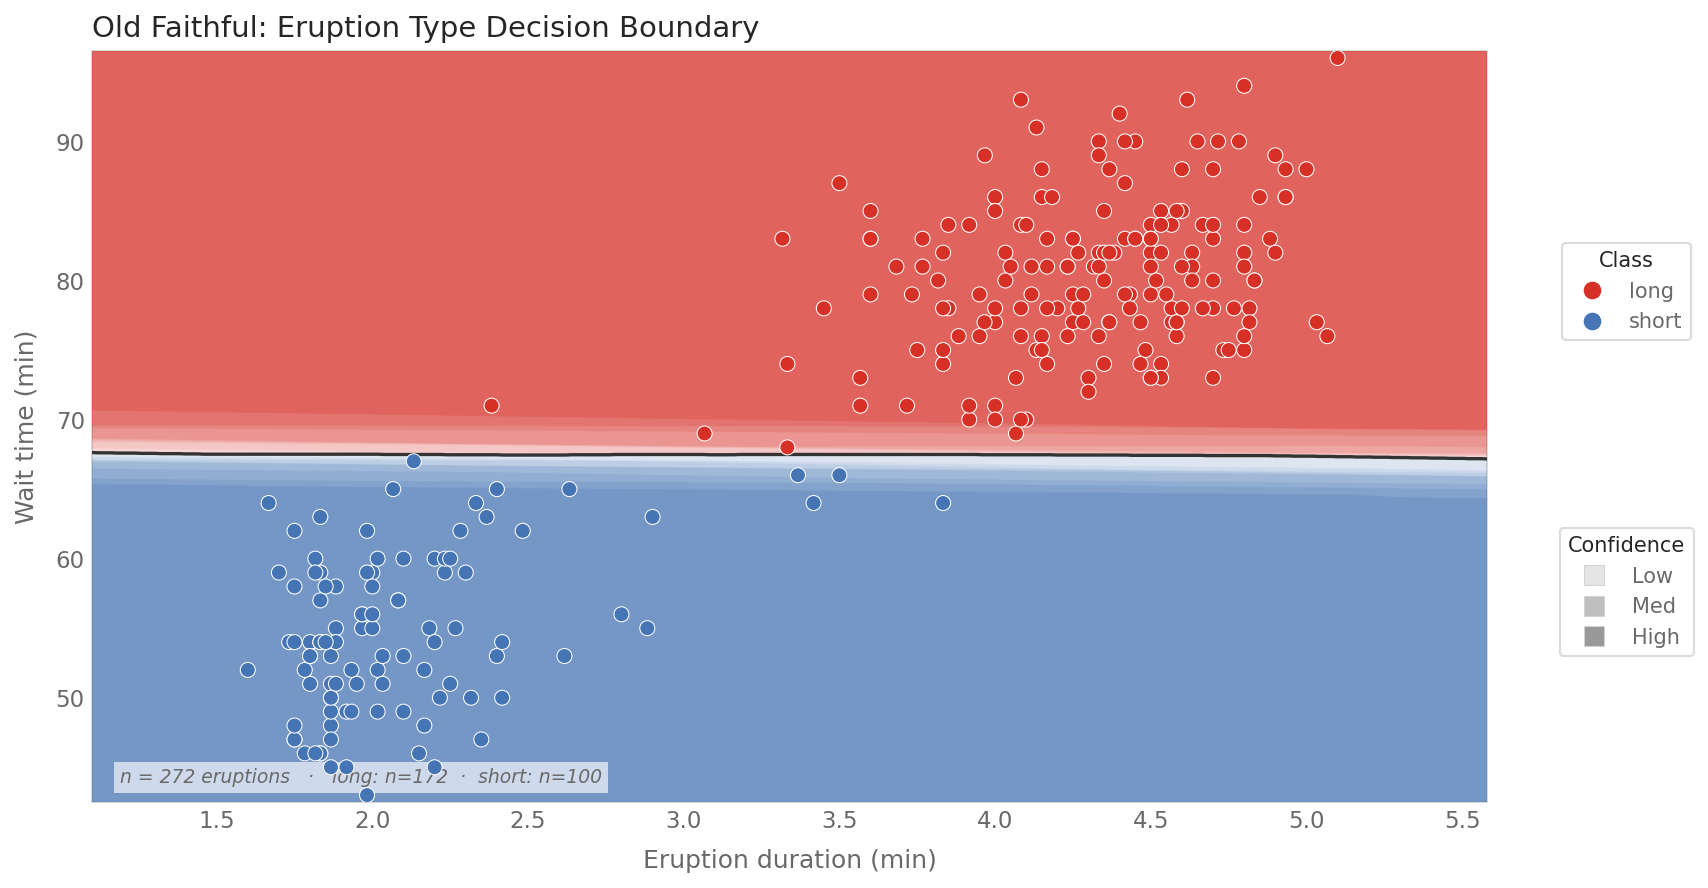
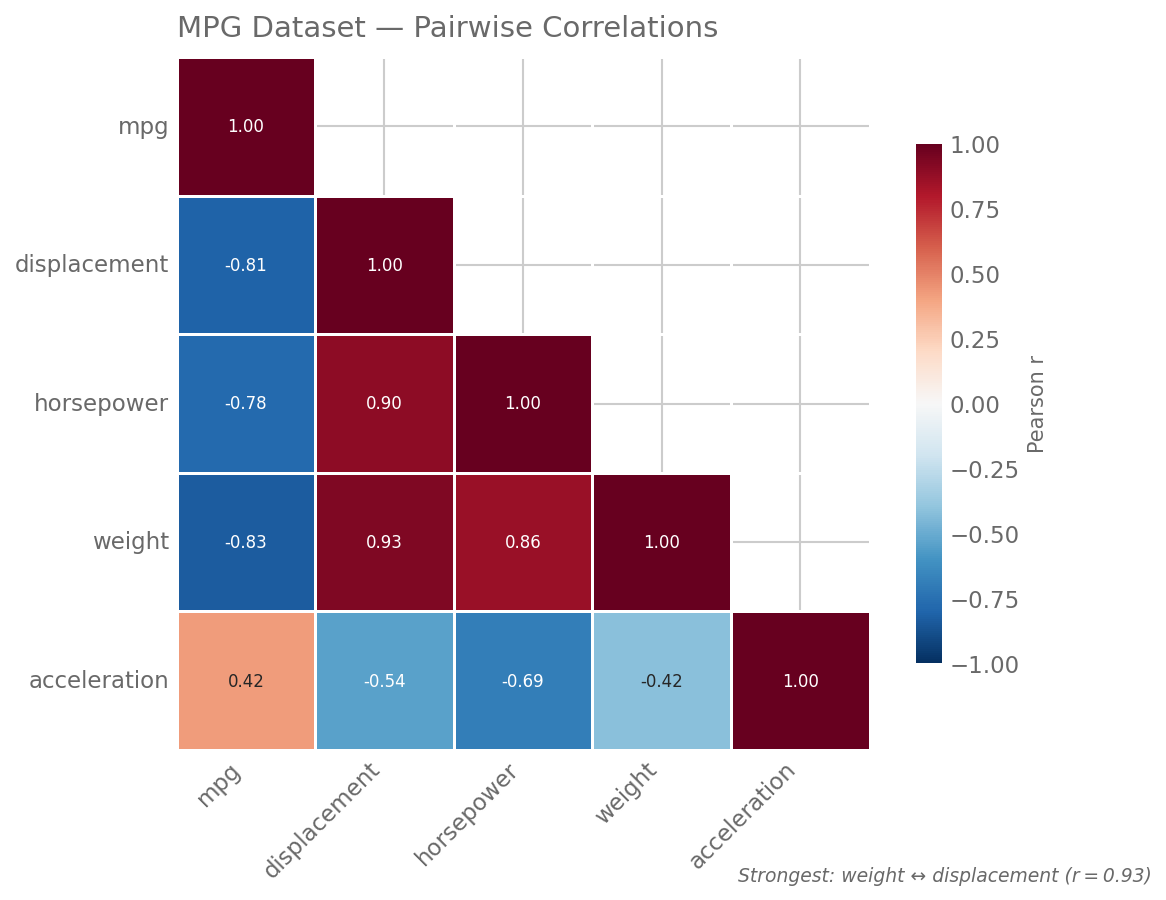
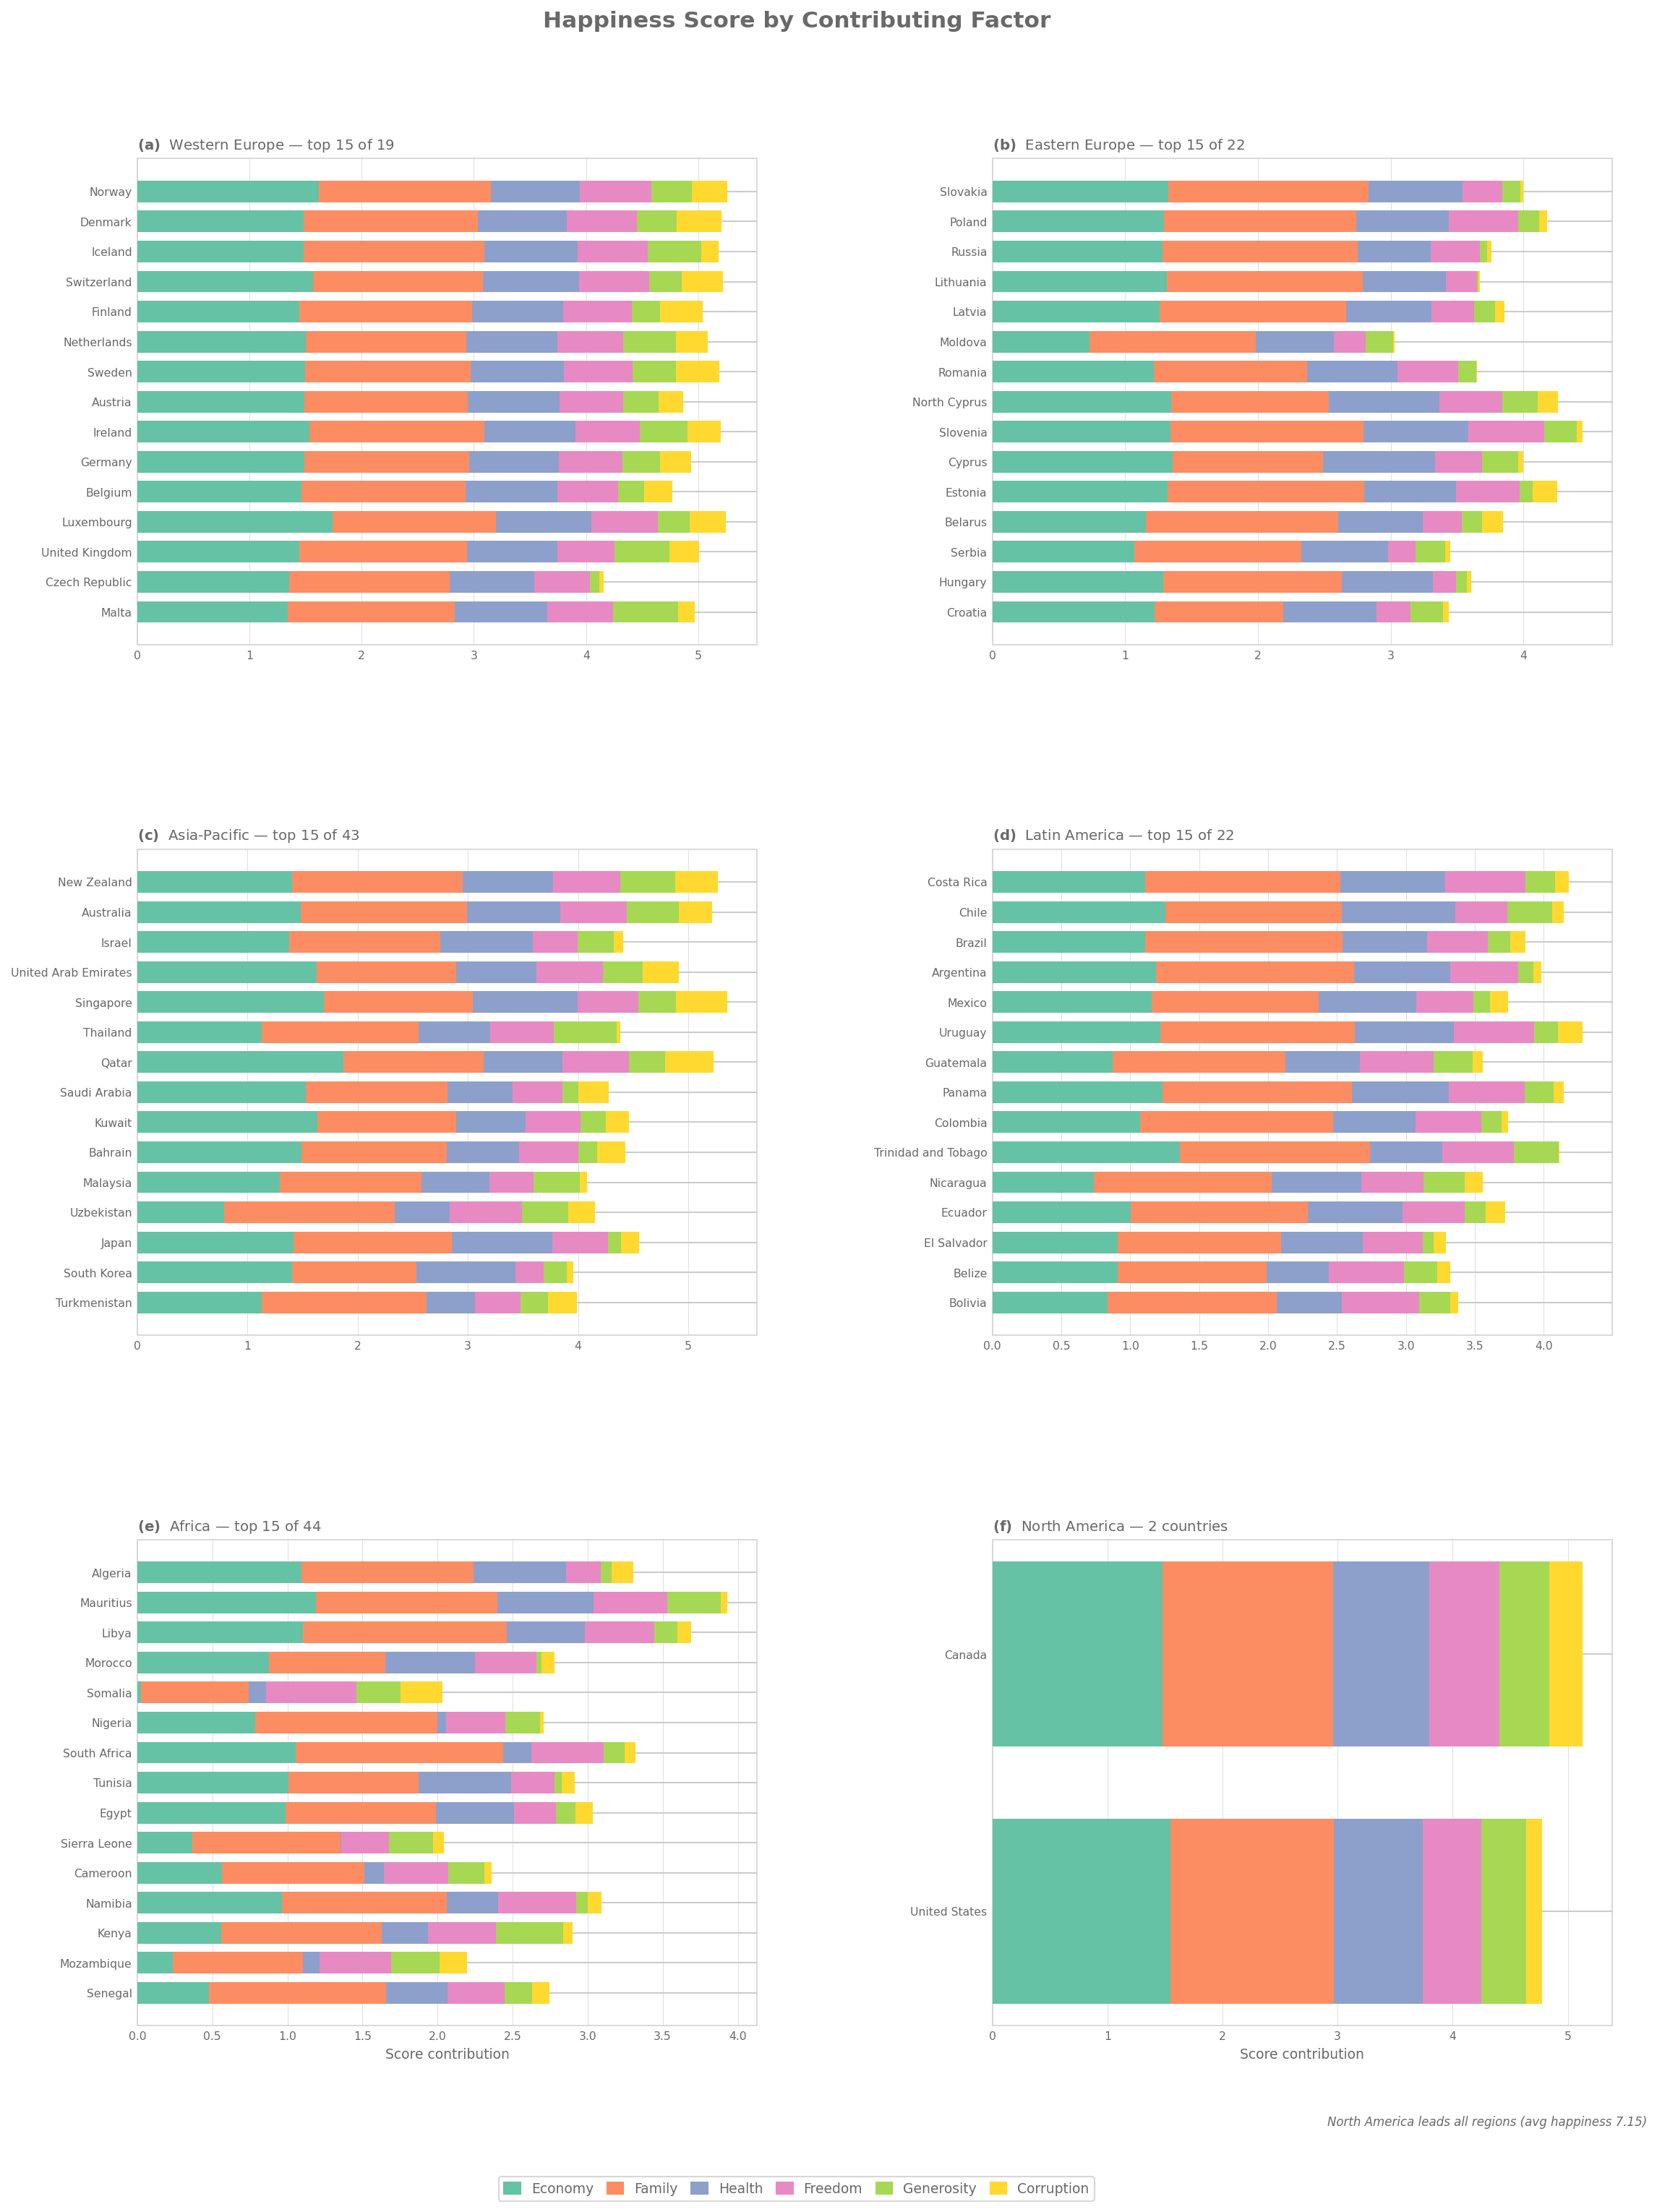
Generate publication-quality Matplotlib and Seaborn charts and diagrams featuring colorblind-accessible palettes, despined axes, and rich annotations for professional data visualizations, plots, and diagrams in Python workflows.
Own this plugin?
Verify ownership to unlock analytics, metadata editing, and a verified badge. GitHub access is read-only (username + org membership).
Sign in to claimOwn this plugin?
Verify ownership to unlock analytics, metadata editing, and a verified badge. GitHub access is read-only (username + org membership).
Sign in to claimBased on adoption, maintenance, documentation, and repository signals. Not a security audit or endorsement.
npx claudepluginhub tvhahn/matplotlib-skillGenerate publication-quality academic diagrams, statistical plots, and presentation slides using PaperBanana multi-agent framework
Edward Tufte's Visual Display of Quantitative Information — three executable skills (route, assess, render) backed by a VDQI-sourced principles reference. Scores graphics against Tufte's nine criteria with named chartjunk species and a 13-entry catalogue of dissected failures, and renders per-genre charts (time-series, small multiples, quartile plot, range-frame scatter) plus a tufte-css HTML wrapper.
Create data visualizations and plots
Create beautiful, self-contained HTML visualizations from any content or idea. Use for slide decks, dashboards, infographics, flowcharts, timelines, cheat sheets, posters, and more.
Generate G6 v5 graph visualization code. Use when user asks for G6 graphs, network graphs, tree graphs, flow charts, mind maps, or any relational/graph-structured data visualization with the G6 library.
MCP server for advanced data visualization and plotting operations


'%20stop-opacity%3D'0.16'%2F%3E%3Cstop%20offset%3D'1'%20stop-color%3D'rgb(200%2C90%2C60)'%20stop-opacity%3D'0.03'%2F%3E%3C%2FlinearGradient%3E%3C%2Fdefs%3E%3Crect%20width%3D'320'%20height%3D'200'%20fill%3D'url(%23g)'%2F%3E%3Ccircle%20cx%3D'250'%20cy%3D'56'%20r%3D'92'%20fill%3D'rgb(200%2C90%2C60)'%20fill-opacity%3D'0.06'%2F%3E%3Ccircle%20cx%3D'64'%20cy%3D'172'%20r%3D'58'%20fill%3D'rgb(200%2C90%2C60)'%20fill-opacity%3D'0.05'%2F%3E%3C%2Fsvg%3E)