Stats
Actions
Available In
Tags
By punt-labs
Visual output surface for Claude Code: display text, images, tables, plots, and interactive elements
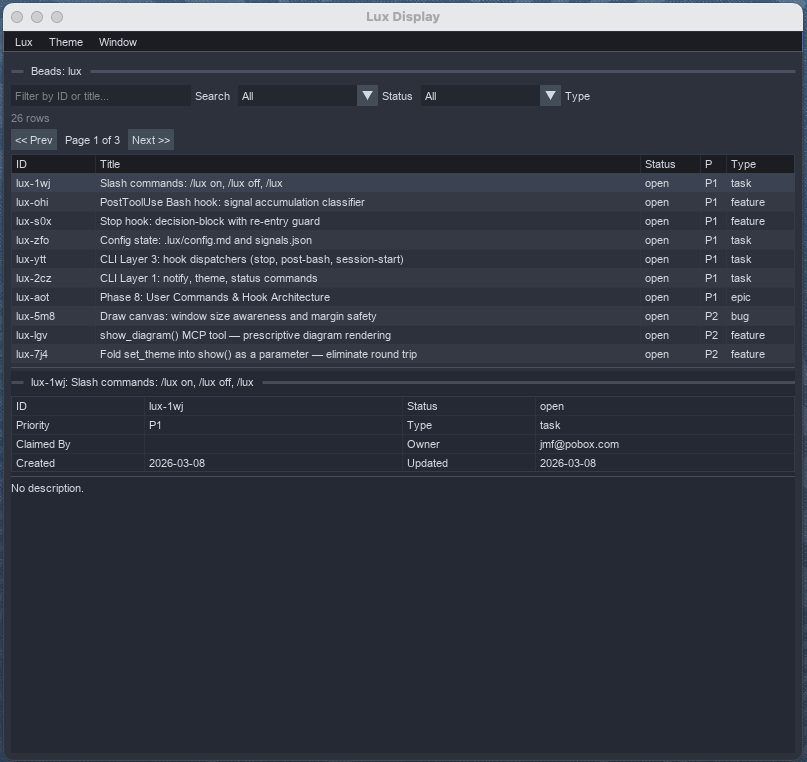
Display a beads issue board in the Lux window with filterable table and detail panel. Use when the user asks to "show beads", "show the board", "show issues", "beads board", "beads UI", "display backlog", "show my work", or wants to visually browse project issues. Also triggered by "issue board", "task board", "kanban", "backlog view", or "bd ready in lux".
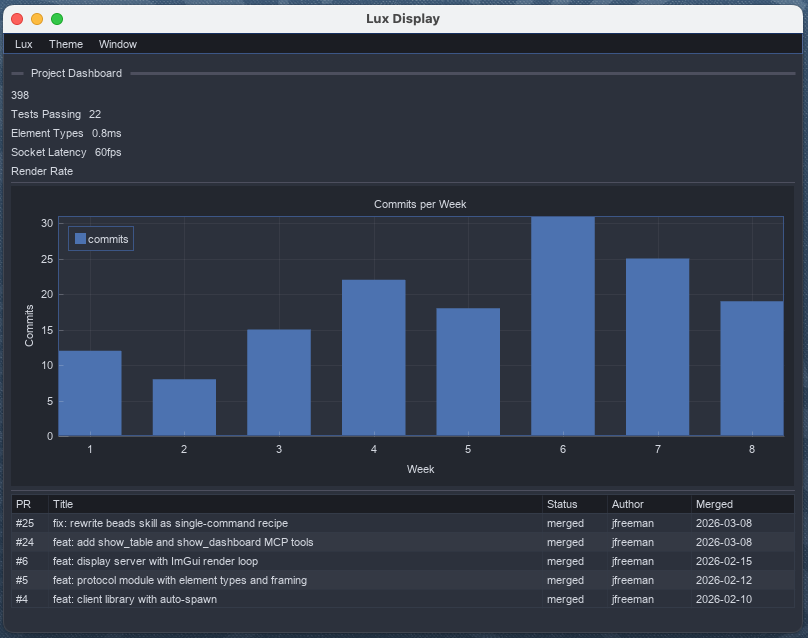
Display a dashboard in the Lux window with metrics cards, charts, and status tables. Use when the user asks to "show a dashboard", "display metrics", "visualize status", "show KPIs", "monitor progress", or wants a visual overview of data. Also triggered by "build a dashboard", "metric cards", or "status overview".
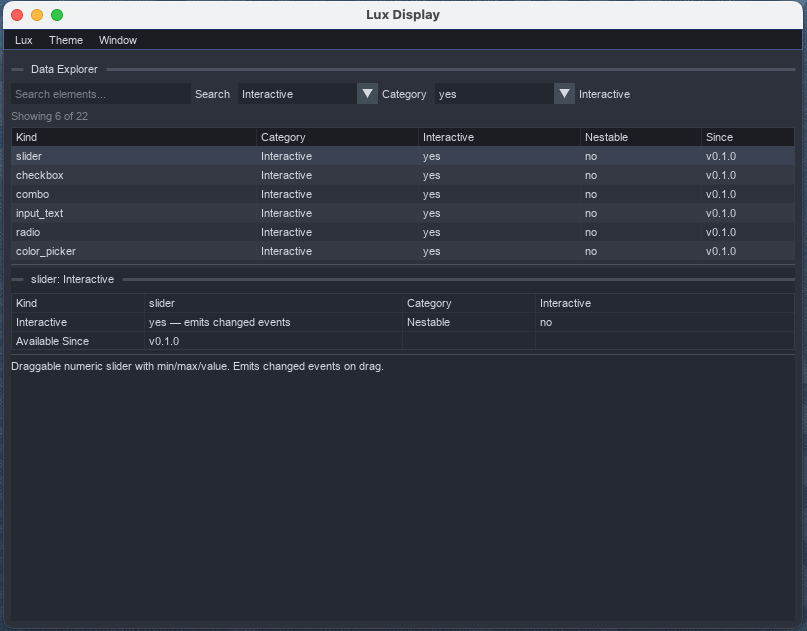
Display an interactive data explorer in the Lux window with filterable tables, search inputs, and detail panels. Use when the user asks to "explore data", "browse results", "filter a table", "search through records", "show me the data", or wants to interactively navigate tabular data. Also triggered by "data viewer", "record browser", "filterable table", or "drill into the data".
Executes bash commands
Hook triggers when Bash tool is used
Based on adoption, maintenance, documentation, and repository signals. Not a security audit or endorsement.
A visual output surface for AI agents.


Lux gives agents and apps a shared visual surface. The intended architecture is a hub/display split: clients send UI descriptions to luxd, the Hub owns authoritative element state and behavior, and the Display renders a replica of the current scene while forwarding user interactions back to the Hub.
The design draws on X11's client/server split and Smalltalk-style live introspection. MCP is one gateway into Lux, not the whole architecture. If you want the short version of the rewrite target, start with docs/architecture/target/target.md. If you need help navigating the docs, use docs/README.md. For the product direction, positioning, and risk assessment — the Working Backwards PR/FAQ — see prfaq.pdf.
Platforms: macOS, Linux
Stage: alpha --- protocol is stable, published on PyPI as punt-lux
A Claude Code plugin displaying a project issue board --- the agent fetches live data from DoltDB via bd list --json, builds a filterable table with detail panel, and renders it in a single tool call. Filters and row selection run at 60fps with zero MCP round-trips.
The same list/detail pattern generalizes to any tabular data. Search, combo filters, pagination, and a detail panel --- all driven by a single show_table() call.
Dashboards compose metric cards, charts, and tables. show_dashboard() builds the layout from structured data --- no manual element positioning needed.
curl -fsSL https://raw.githubusercontent.com/punt-labs/lux/00c88f6/install.sh | sh
Restart Claude Code twice. The Lux display window opens automatically when agents send visual output.
uv tool install 'punt-lux[display]'
Then install the plugin via the marketplace:
claude plugin marketplace add punt-labs/claude-plugins
claude plugin install lux@punt-labs
If you only need the lux CLI and the JSON protocol element types --- enough to
drive a running luxd over its REST API and to build element trees in Python
--- install the base package:
uv add punt-lux
This pulls ~2 MB of lightweight deps. The 66 MB display stack (imgui-bundle, numpy, Pillow, PyOpenGL) is only needed to run the renderer (lux display) and is available via punt-lux[display].
curl -fsSL https://raw.githubusercontent.com/punt-labs/lux/00c88f6/install.sh -o install.sh
shasum -a 256 install.sh
cat install.sh
sh install.sh
lux display &
uv run python demos/dashboard.py
Demos are in demos/ --- each connects as a client and drives the display:
| Demo | What it shows |
|---|---|
interactive.py | Sliders, checkboxes, combos, text inputs, color pickers |
containers.py | Windows, tab bars, collapsing headers, groups |
dashboard.py | Multi-window layout with draw canvases and live controls |
data_viz.py | Tables, plots, progress bars, spinners, markdown |
menu_bar.py | Custom menus, event handling, periodic refresh |
npx claudepluginhub punt-labs/claude-plugins --plugin luxAmazon Working Backwards PR/FAQ process — generate professional LaTeX documents for product discovery and decision-making
Autonomous agent daemon with cryptographic owner control. Email communication via IMAP/SMTP with PGP trust model.
Create, validate, and test formal Z specifications for stateful systems using fuzz and probcli
Local semantic search for Claude Code: /find, /ingest, /remember, /explain, /source, /quarry
Identity binding for humans and AI agents — voice, email, GitHub, writing style, personality.
Build Vizro dashboards from concept to deployment. Enforces a 2-phase workflow covering requirements, layout design, visualization selection, implementation with Python, and testing.
Turn a free-text dashboard request into an interactive HTML demo and a Replace-Data-Source-ready Tableau .twbx, via 8 single-job skills that hand off through files on disk. See CONTRACT.md for the inter-skill API.
AI-native UX design system using uxscii standard - create, validate, and compose UI designs through natural language
Comprehensive Material UI (MUI) expert plugin — 26 skills, 14 commands, 7 agents covering theming, CSS variables, Pigment CSS, components, sx/styled, slots API, MUI X (DataGrid, DatePickers, Charts, TreeView), accessibility, performance, SSR/Next.js, animations, virtualization, forms, white-label/multi-tenant, headless (MUI Base), Joy UI, i18n/RTL, testing, migration, entity-driven CRUD, ecosystem integrations, and 200+ creative widget patterns.
Data analytics & BI engineer — dashboards, metrics design, reporting, data storytelling
Structured documents for AI agents — 45 production-ready components with a coherent visual system. Decisions, architecture flows, collapsible references, metrics, and charts rendered as self-contained HTML.
'%20stop-opacity%3D'0.16'%2F%3E%3Cstop%20offset%3D'1'%20stop-color%3D'rgb(200%2C90%2C60)'%20stop-opacity%3D'0.03'%2F%3E%3C%2FlinearGradient%3E%3C%2Fdefs%3E%3Crect%20width%3D'320'%20height%3D'200'%20fill%3D'url(%23g)'%2F%3E%3Ccircle%20cx%3D'250'%20cy%3D'56'%20r%3D'92'%20fill%3D'rgb(200%2C90%2C60)'%20fill-opacity%3D'0.06'%2F%3E%3Ccircle%20cx%3D'64'%20cy%3D'172'%20r%3D'58'%20fill%3D'rgb(200%2C90%2C60)'%20fill-opacity%3D'0.05'%2F%3E%3C%2Fsvg%3E)