claudetop
You're spending $20/day on Claude Code and can't see it.
claudetop shows you exactly where your tokens and dollars go — in real time.


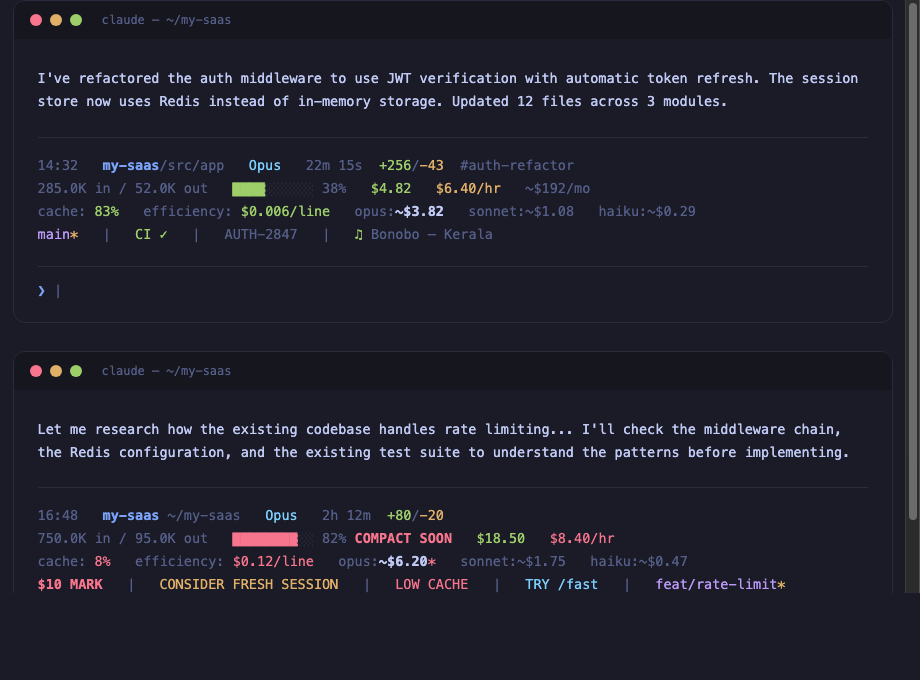
14:32  my-project/src/app  Opus  20m 0s  +256/-43  #auth-refactor
152.3K in / 45.2K out  ████░░░░░░ 38%  $3.47  $5.10/hr  ~$174/mo
cache: 66%  efficiency: $0.012/line  opus:~$3.20  sonnet:~$0.88  haiku:~$0.23
in:80% out:20% (fresh:15% cwrite:7% cread:76%)
$5 MARK  |  main*  |  ♫ Artist - Song  |  PROJ-123  |  CI ✓
The problem
Claude Code doesn't show you what you're spending. You finish a session, check your billing dashboard, and discover a $65 charge for what felt like 30 minutes of work. You have no idea which session caused it, which model was wasteful, or whether your cache was even working.
I built claudetop after noticing my model estimate showed $10 but the actual bill was $65. Turns out, compaction was hiding 80% of my token usage. The cost was real — the visibility wasn't.
Install
Clone and install (recommended)
git clone https://github.com/liorwn/claudetop.git
cd claudetop && ./install.sh
One-liner
curl -fsSL https://raw.githubusercontent.com/liorwn/claudetop/main/install.sh | bash
As a Claude Code plugin
claude plugin marketplace add liorwn/claudetop
claude plugin install claudetop
This gives you the SessionEnd hook + all slash commands (/claudetop:stats, /claudetop:dashboard, /claudetop:branch, /claudetop:export, /claudetop:pricing) automatically.
Then restart Claude Code.
What you see
Before claudetop
>
A blank prompt. No context. No cost. No idea.
After claudetop
14:32  my-project/src/app  Opus  20m 0s  +256/-43  #auth-refactor
152.3K in / 45.2K out  ████░░░░░░ 38%  $3.47  $5.10/hr  ~$174/mo
cache: 66%  efficiency: $0.012/line  opus:~$3.20  sonnet:~$0.88  haiku:~$0.23
$5 MARK  |  TRY /fast  |  main*  |  CI ✓  |  ♫ Bonobo - Kerala
Every response, you see:
- What project you're in and how deep
- What model is running and for how long
- What it costs right now, per hour, and projected monthly
- How efficient your cache is (are you wasting tokens?)
- What it would cost on a different model (should you switch?)
- Smart alerts when something is wrong
Features
Real-time cost tracking
Your actual session cost (green), burn rate per hour, and monthly forecast extrapolated from your history. No more billing surprises.
Model cost comparison
See what your session would cost on Opus, Sonnet, or Haiku — with cache-aware pricing that accounts for your actual cache hit ratio. The current model is bolded so you can instantly compare.
Pricing updates automatically from the pricing.json in this repo — when Anthropic changes prices, claudetop stays current.
Cache efficiency
Your cache hit ratio tells you if you're being efficient. Green (≥60%) means most of your input tokens are being reused. Red (<30%) means something is forcing full re-reads — maybe compaction, maybe a model switch.
Smart alerts
Only appear when something needs your attention:
| Alert | What happened | What to do |
|---|
$5 MARK / $10 / $25 | Cost milestone crossed | Gut-check: am I getting value? |
OVER BUDGET | Daily budget exceeded | Wrap up or switch models |
CONSIDER FRESH SESSION | >2hrs + >60% context | Start fresh — diminishing returns |
LOW CACHE | <20% cache after 5min | Context was reset, tokens being re-read |
BURN RATE | >$15/hr velocity | Runaway subagents or tight loops |
SPINNING? | >$1 spent, zero code output | Stuck in a research loop |
TRY /fast | >$0.05/line on Opus | This task doesn't need the biggest model |
COMPACT SOON | Context window >80% full | Auto-compaction is imminent |
Session history & analytics
Every session is automatically logged. See where your money goes:
claudetop-stats              # Today's summary
claudetop-stats week         # This week
claudetop-stats month        # This month
claudetop-stats all          # All time
claudetop-stats tag auth     # Filter by tag
claudetop-stats  This Week
──────────────────────────────────────────────────────

Summary
  Sessions:     12
  Total cost:   $47.30
  Avg / session:  $3.94
  Daily avg:      $9.46
'%20stop-opacity%3D'0.16'%2F%3E%3Cstop%20offset%3D'1'%20stop-color%3D'rgb(200%2C90%2C60)'%20stop-opacity%3D'0.03'%2F%3E%3C%2FlinearGradient%3E%3C%2Fdefs%3E%3Crect%20width%3D'320'%20height%3D'200'%20fill%3D'url(%23g)'%2F%3E%3Ccircle%20cx%3D'250'%20cy%3D'56'%20r%3D'92'%20fill%3D'rgb(200%2C90%2C60)'%20fill-opacity%3D'0.06'%2F%3E%3Ccircle%20cx%3D'64'%20cy%3D'172'%20r%3D'58'%20fill%3D'rgb(200%2C90%2C60)'%20fill-opacity%3D'0.05'%2F%3E%3C%2Fsvg%3E)