Stats
Links
Categories
Vizro Marketplace for tooling and skills around dashboard design and implementation
npx claudepluginhub mckinsey/vizroBuild Vizro dashboards from concept to deployment. Enforces a 2-phase workflow covering requirements, layout design, visualization selection, implementation with Python, and testing.

![]()
![]()
![]()
Vizro is an open-source Python-based toolkit.
Use it to build beautiful and powerful data visualization apps quickly and easily, without needing advanced engineering or visual design expertise.
Then customize and deploy your app to production at scale.
In just a few lines of simple low-code configuration, with in-built visual design best practices, you can quickly assemble high-quality, multi-page prototypes, that are production-ready.
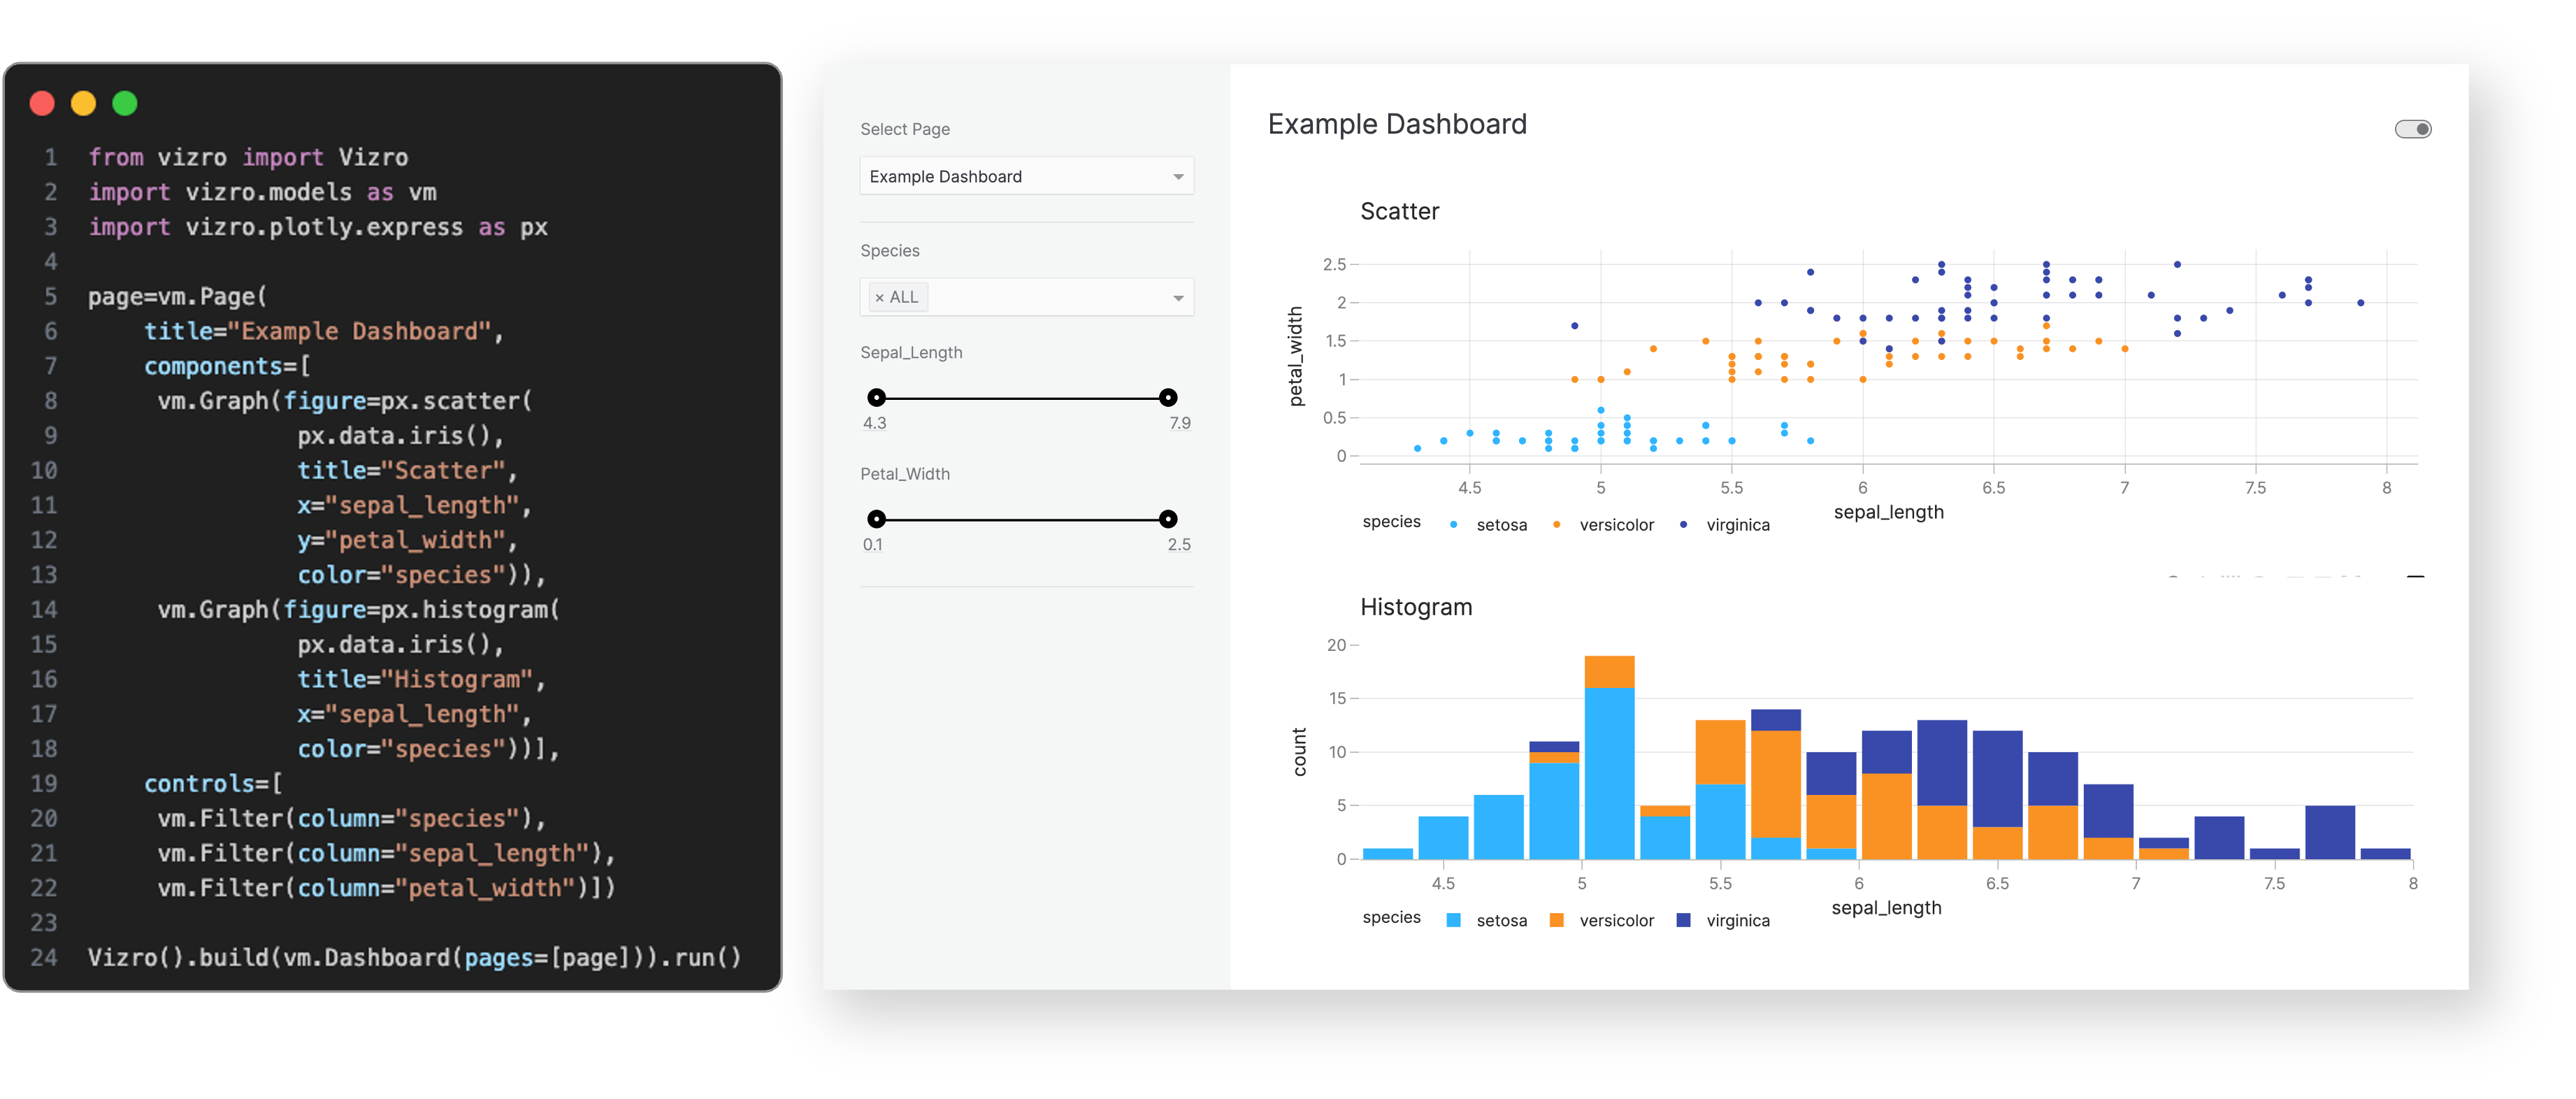
Every Vizro app is defined by a simple configuration, using these high-level categories:
Configuration can be written in multiple formats including Pydantic models, JSON, YAML or Python dictionaries for added flexibility of implementation.
Optional high-code extensions enable almost infinite customization in a modular way, combining the best of low-code and high-code - including bespoke visual formatting and custom components.
Visit our "How-to guides" for a more detailed explanation of Vizro features.
The benefits of the Vizro toolkit include:

Vizro helps you to build data visualization apps that are:
Quick and easy
Build apps in minutes. Use a few lines of simple configuration (via Pydantic models, JSON, YAML, or Python dictionaries) in place of thousands of lines of code.
Beautiful and powerful
Build high-quality multi-page apps without needing advanced engineering or visual design expertise. Use powerful features of production-grade BI tools, with in-built visual design best practices.
Flexible
Benefit from the capabilities and flexibility of open-source packages. Use the trusted dependencies of Plotly, Dash, and Pydantic.
Customizable
Almost infinite control for advanced users. Use Python, JavaScript, HTML and CSS code extensions.
Scalable
Claude Code marketplace entries for the plugin-safe Antigravity Awesome Skills library and its compatible editorial bundles.
Production-ready workflow orchestration with 84 marketplace plugins, 192 local specialized agents, and 156 local skills - optimized for granular installation and minimal token usage
Directory of popular Claude Code extensions including development tools, productivity plugins, and MCP integrations
'%20stop-opacity%3D'0.16'%2F%3E%3Cstop%20offset%3D'1'%20stop-color%3D'rgb(200%2C90%2C60)'%20stop-opacity%3D'0.03'%2F%3E%3C%2FlinearGradient%3E%3C%2Fdefs%3E%3Crect%20width%3D'320'%20height%3D'200'%20fill%3D'url(%23g)'%2F%3E%3Ccircle%20cx%3D'250'%20cy%3D'56'%20r%3D'92'%20fill%3D'rgb(200%2C90%2C60)'%20fill-opacity%3D'0.06'%2F%3E%3Ccircle%20cx%3D'64'%20cy%3D'172'%20r%3D'58'%20fill%3D'rgb(200%2C90%2C60)'%20fill-opacity%3D'0.05'%2F%3E%3C%2Fsvg%3E)