
Argus


One CLI for all JVM diagnostics. 71 commands, zero agent required, works on Java 11+.
The free alternative to GCEasy + jcmd + VisualVM + Arthas + Eclipse MAT combined — GC analysis, health diagnosis, flame graphs, async-profiler integration, MAT-class heap leak analysis, continuous profiling, distributed-tracing correlation, opt-in live method instrumentation, ZGC live monitoring, and CI/CD profile gates.
Quick Start
# Install (macOS / Linux)
curl -fsSL https://raw.githubusercontent.com/rlaope/argus/master/install.sh | bash

# Windows (PowerShell)
irm https://raw.githubusercontent.com/rlaope/argus/master/install.ps1 | iex
argus doctor <pid>              # One-click JVM health diagnosis
argus zgc <pid>                 # ZGC live diagnosis (30s JFR capture + verdict)
argus profile <pid> --duration=30  # CPU/allocation profiling via async-profiler
Shell completions (bash, zsh, fish, PowerShell) are installed automatically.
JVM Harness
Continuous JVM monitoring + optimization + troubleshooting on top of Argus, available as a Claude Code plugin.
/plugin marketplace add https://github.com/rlaope/Argus
/plugin install argus-jvm-harness
CLI equivalent (no Claude Code required):
argus harness <pid>                          # 30-min trend-aware health watch
argus harness <pid> --profile=quick --duration=1m
argus harness <pid> --out=session.json --format=json
The harness samples on a fixed interval, runs the doctor rule set plus four trend rules (heap-leak regression, GC overhead trend, thread growth, pause-time regression), and produces a single session report with severity-ranked findings and JVM-flag suggestions.
Full reference: docs/harness.md
Why Argus?
One CLI to diagnose a live JVM and watch a fleet — no agent, no restart, no -javaagent. It attaches externally over jcmd/JMX and reads the JVM right where it runs.
- Zero-install live attach — point it at a PID; the target needs no restart and no agent flag.
- One-command health verdict —
argus doctor returns HEALTHY / WARN / CRITICAL with machine-readable exit codes for CI gates.
- MAT-class heap analysis, offline — dominator tree, retained sizes, and automated leak suspects on multi-GB dumps within a bounded heap.
- Continuous profiling, no TSDB — disk-backed per-pod CPU/alloc flamegraphs with time-window merges and differential views.
- GC ↔ trace correlation — see which traces a GC pause stalled, exported as OTel spans and Prometheus exemplars.
- Opt-in live instrumentation — watch/trace/monitor method args, returns, and timing via dynamic attach; default OFF, auto-detach, zero residual bytecode.
- JVM right-sizing for FinOps —
argus rightsize recommends -Xmx and container memory from observed heap high-water-mark and GC headroom.
- GC-aware verdicts & Loom —
argus g1 / argus zgc flag allocation stalls, cycle overlap, and SoftMax breaches; virtual-thread pinning detection on Java 21+.
- OpenTelemetry-native — OpenMetrics
/prometheus, OTLP export, and a shipped Grafana dashboard.
71 commands in total — full reference: docs/cli-commands.md
Roadmap At A Glance
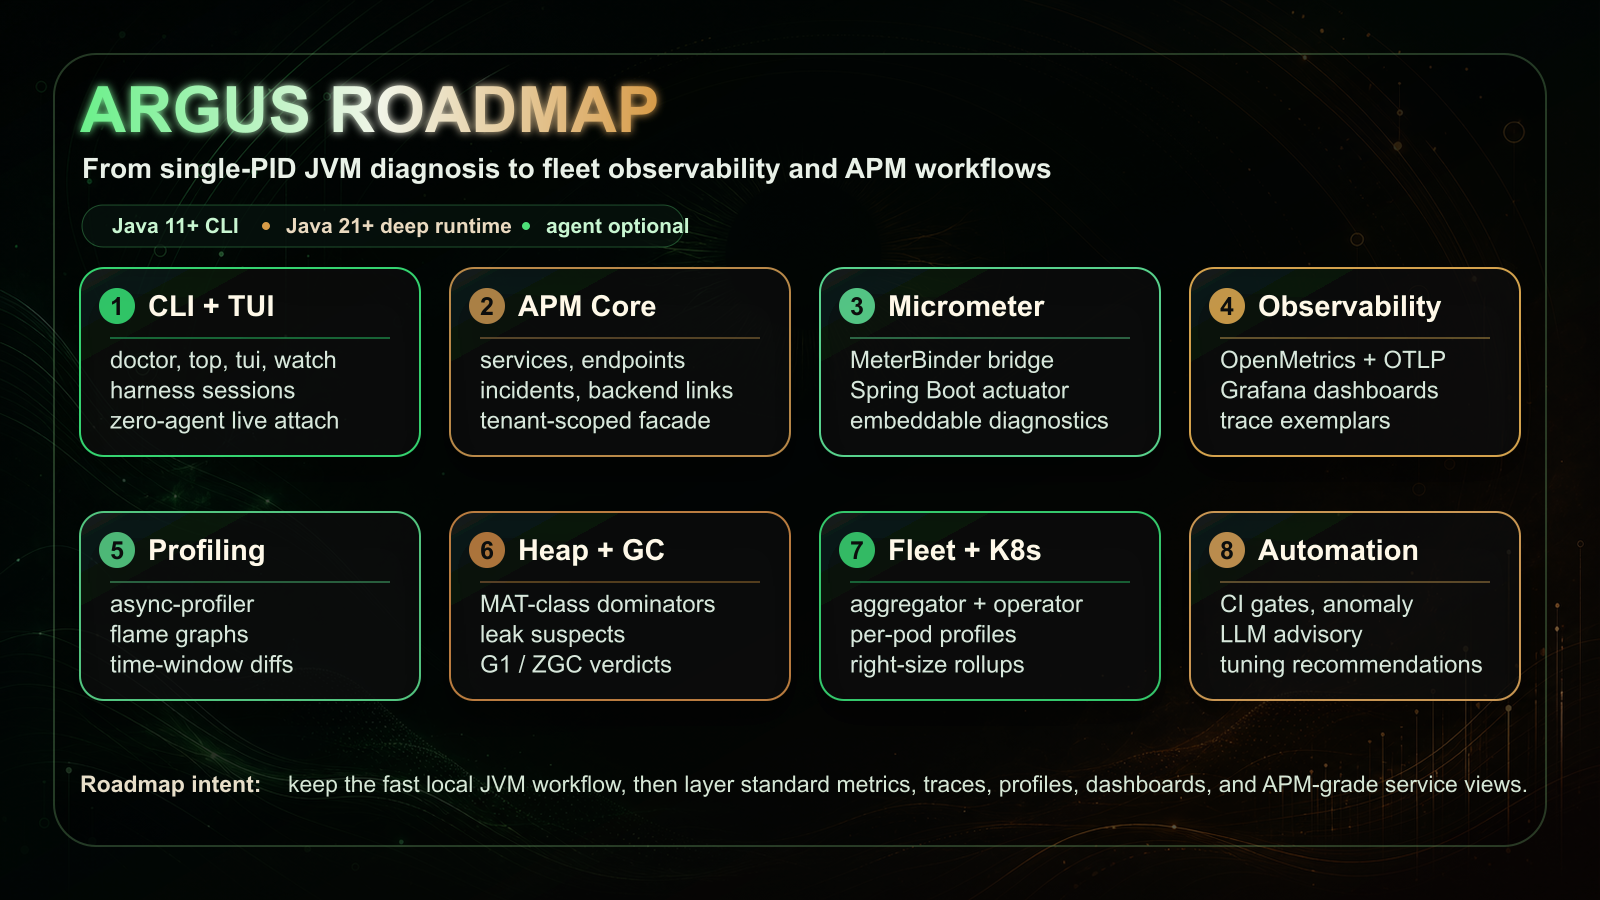
Argus keeps the fast single-PID JVM workflow at the center, then layers standard metrics, traces, profiles, dashboards, fleet views, and APM-grade service workflows around it.
Example: argus doctor <pid>
$ argus doctor 39113
'%20stop-opacity%3D'0.16'%2F%3E%3Cstop%20offset%3D'1'%20stop-color%3D'rgb(200%2C90%2C60)'%20stop-opacity%3D'0.03'%2F%3E%3C%2FlinearGradient%3E%3C%2Fdefs%3E%3Crect%20width%3D'320'%20height%3D'200'%20fill%3D'url(%23g)'%2F%3E%3Ccircle%20cx%3D'250'%20cy%3D'56'%20r%3D'92'%20fill%3D'rgb(200%2C90%2C60)'%20fill-opacity%3D'0.06'%2F%3E%3Ccircle%20cx%3D'64'%20cy%3D'172'%20r%3D'58'%20fill%3D'rgb(200%2C90%2C60)'%20fill-opacity%3D'0.05'%2F%3E%3C%2Fsvg%3E)