Stats
Actions
Available In
Tags
Investigate traces, logs, and metrics across an OpenSearch and Prometheus observability stack using PPL and PromQL queries to correlate data, diagnose errors, monitor RED metrics, define SLOs, and troubleshoot GenAI agent performance.
APM RED metrics (Rate, Errors, Duration) for service-level monitoring using PromQL and PPL queries.
Cross-signal correlation between traces, logs, and metrics using OTel semantic convention fields for end-to-end observability investigations.
Query and search log data from OpenSearch using PPL for severity filtering, trace correlation, error patterns, and log volume analysis.
Query metrics from Prometheus using PromQL for HTTP request rates, latency percentiles, error rates, active connections, and GenAI token usage.
Query OpenSearch Dashboards APIs for workspace configuration, index pattern discovery, APM correlation configs, and saved objects.
Based on adoption, maintenance, documentation, and repository signals. Not a security audit or endorsement.
![]()
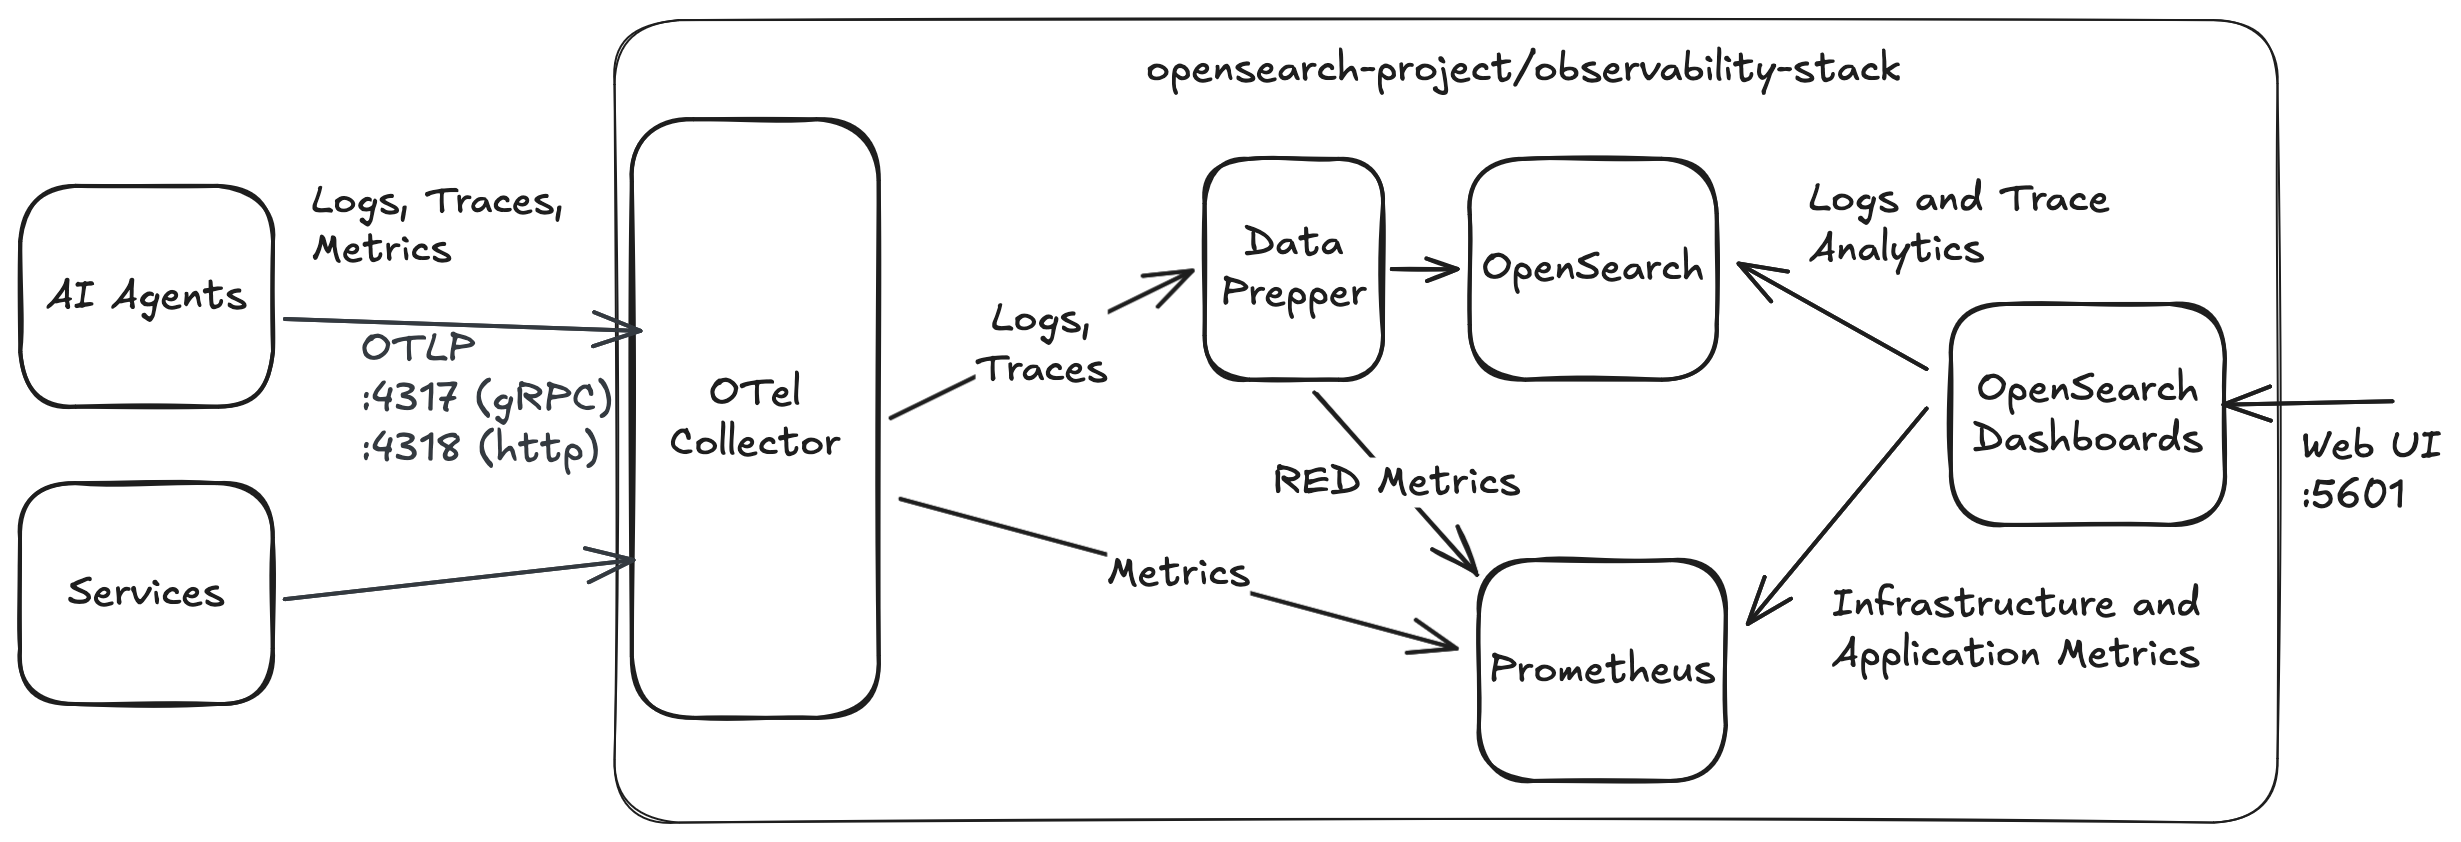
Observability Stack is an open-source stack designed for modern distributed systems. Built on OpenTelemetry, OpenSearch, and Prometheus, Observability Stack provides a complete, pre-configured infrastructure for monitoring microservices, web applications, and AI agents—with first-class support for agent observability through OpenTelemetry Gen-AI Semantic Conventions.
https://github.com/user-attachments/assets/bef4c3ad-c64d-4db8-96f5-9ffd26bd0b03
Use our interactive installer for the best experience:
curl -fsSL https://raw.githubusercontent.com/opensearch-project/observability-stack/main/install.sh | bash
The installer will:
Installer flags:
| Flag | Description |
|---|---|
--simulate | Preview the installer output without actually installing |
--skip-pull | Skip pulling container images (uses cached images) |
--help | Show help message |
To run the installer locally (e.g. after cloning):
./install.sh                # Full install
./install.sh --simulate     # Dry run
./install.sh --skip-pull    # Skip image pulls (useful for re-installs)
Installation takes 8-15 minutes. After completion, access:
| Service | URL | Credentials |
|---|---|---|
| OpenSearch Dashboards | http://localhost:5601 | admin / My_password_123!@# |
| Prometheus | http://localhost:9090 | (none) |
| OpenSearch API | https://localhost:9200 | admin / My_password_123!@# |
To get started manually with Docker Compose:
git clone https://github.com/opensearch-project/observability-stack.git
cd observability-stack
The .env file contains all configurable parameters:
INCLUDE_COMPOSE_EXAMPLES=docker-compose.examples.yml. Comment out to run only the core stack.INCLUDE_COMPOSE_OTEL_DEMO=docker-compose.otel-demo.yml to add the full OpenTelemetry Demo microservices app for realistic e-commerce telemetry (~2GB additional memory required).See Configuration section for more details.
docker compose up -d
This starts all services including example services (multi-agent travel planner, weather-agent, events-agent, and canary) that generate sample telemetry data.
👉 Navigate to http://localhost:5601
Username and password can be retrieved from .env file:
grep -E '^OPENSEARCH_(USER|PASSWORD)=' .env
To stop the stack while preserving your data:
docker compose down
To stop the stack and remove all data volumes:
docker compose down -v
Observability Stack accepts telemetry data via the OpenTelemetry Protocol (OTLP) and follows the OpenTelemetry Gen-AI Semantic Conventions for standardized attribute naming and structure for AI agents.
The OTel Collector exposes two OTLP endpoints — choose the one that matches your SDK's protocol:
| Port | Protocol | Endpoint | Used By |
|---|---|---|---|
| 4317 | gRPC | http://localhost:4317 | OpenTelemetry SDK (default), most language SDKs |
| 4318 | HTTP/protobuf | http://localhost:4318 | Strands SDK (setup_otlp_exporter()), HTTP-based exporters |
npx claudepluginhub opensearch-project/observability-stack --plugin observabilityOpenSearch skills to help set up and deploy OpenSearch for a variety of use cases: build search applications with semantic, hybrid, neural sparse, and agentic search strategies; analyze observability data with log analytics (PPL and Query DSL) and distributed traces (OpenTelemetry); deploy to Amazon OpenSearch Service or OpenSearch Serverless with Bedrock integration for embeddings and RAG. Just ask your AI assistant to set up a search app, query logs, investigate traces, or deploy to AWS.
Official SigNoz plugin for MCP setup, docs, queries, dashboards, and alerts
Skills, agents, and workflows for Honeycomb observability — query patterns, production investigations, SLOs, OpenTelemetry instrumentation, and Beeline migration. Designed to complement the Honeycomb MCP server.
Metrics collection, logging infrastructure, distributed tracing, SLO implementation, and monitoring dashboards
Axiom CLI and APL query assistance for Claude Code
Dynatrace observability skills. DQL query patterns, application and infrastructure monitoring, log analysis, problem investigation, and incident response workflows. Use with dtctl or the Dynatrace MCP server (https://docs.dynatrace.com/docs/shortlink/dynatrace-mcp-server) for live platform access.
Traceway skills: /tw:traceway debugs production issues through the traceway CLI, /tw:traceway-setup instruments a project to report to a Traceway instance.
'%20stop-opacity%3D'0.16'%2F%3E%3Cstop%20offset%3D'1'%20stop-color%3D'rgb(200%2C90%2C60)'%20stop-opacity%3D'0.03'%2F%3E%3C%2FlinearGradient%3E%3C%2Fdefs%3E%3Crect%20width%3D'320'%20height%3D'200'%20fill%3D'url(%23g)'%2F%3E%3Ccircle%20cx%3D'250'%20cy%3D'56'%20r%3D'92'%20fill%3D'rgb(200%2C90%2C60)'%20fill-opacity%3D'0.06'%2F%3E%3Ccircle%20cx%3D'64'%20cy%3D'172'%20r%3D'58'%20fill%3D'rgb(200%2C90%2C60)'%20fill-opacity%3D'0.05'%2F%3E%3C%2Fsvg%3E)