Stats
Actions
Available In
Tags

Automate end-to-end creation, formatting, validation, and publishing of Power BI reports using the pbir CLI. Enforces design standards, validates custom visuals (Deneb/Vega, Python, R, SVG DAX), and provides actionable feedback on layout, performance, and accessibility.
Review a Deneb visual spec before presenting it to the user. Validates Vega/Vega-Lite syntax, Deneb-specific conventions, and provides design feedback.
Review a Python visual script before presenting it to the user. Validates matplotlib/seaborn code, Power BI conventions, and provides design feedback.
Review an R visual script before presenting it to the user. Validates ggplot2 code, Power BI conventions, and provides design feedback.
Review an SVG DAX measure before presenting it to the user. Validates SVG syntax, DAX conventions, and provides design feedback.
Step-by-step workflow for creating complete Power BI reports from scratch using pbir CLI. Covers model discovery, report creation, page layout, theme setup, visual placement, field binding, filtering, formatting, validation, and publishing. Automatically invoke when the user asks to "create a new report", "build a report from scratch", "make a dashboard", "set up a report with KPIs", "create an executive dashboard", "add pages and visuals to a new report".
Design, enforce, audit, and validate Power BI report themes through the pbir CLI. Invoke when a report uses a default or minimal theme, visuals have inconsistent formatting or many local overrides, or the user asks to create, copy, apply, standardize, rebrand, audit, or validate a theme; change theme colors or typography; promote visual formatting into the theme; clear overrides; or improve theme compliance.
The Power BI report design canon covering design identity, visual hierarchy and the 3-30-300 rule, layout/spacing/alignment, color discipline, chart selection, KPI and card design, tables and matrices, accessibility, and the closing design gate. The shared reference home for report design judgment, routed to by the create-pbi-report, pbir-cli, review-report, modifying-theme-json, and custom-visual skills. Load when committing a design identity or making a design, layout, color, chart-selection, or accessibility decision for a report.
This skill should be used whenever the user mentions "pbir", "pbir-cli", "Power BI reports", or "PBI reports", works with .pbir, .pbip, or .pbix files, or wants to refresh, screenshot, or visually verify a report that is open in Power BI Desktop. Covers creating, exploring, formatting, validating, and publishing Power BI reports through the pbir CLI and object model, plus driving Power BI Desktop (canvas reload, page screenshots) and querying connected or local semantic models.
Actionable feedback on the quality, usage, and effectiveness of Power BI reports. Automatically invoke when the user asks to "review a report", "audit a report", "report usage analysis", "report health check", "find unused reports", "check if a report is being used", "assess report performance", "evaluate report quality".
Own this plugin?
Verify ownership to unlock analytics, metadata editing, and a verified badge. GitHub access is read-only (username + org membership).
Sign in to claimOwn this plugin?
Verify ownership to unlock analytics, metadata editing, and a verified badge. GitHub access is read-only (username + org membership).
Sign in to claimBased on adoption, maintenance, documentation, and repository signals. Not a security audit or endorsement.
The best source for Power BI AI skills and agentic development resources in one marketplace
Teach AI agents like Claude Code or GitHub Copilot Power BI and Microsoft Fabric



[!WARNING] These skills are under active development with a weekly release cadence, so expect regular renaming and restructuring.
Versions 26.26 through 26.38 are a deliberate breaking transition. Skills may be consolidated, renamed, removed, or made less automatic between weekly releases in this range. Pin 26.25 or earlier if you need the pre-transition skill structure and behavior; do not assume compatibility from one transition release to the next.
Here's how you get started in Claude Code; run this in the terminal to get the marketplace:
claude plugin marketplace add data-goblin/power-bi-agentic-development
Click here for a YouTube walkthrough
Add the marketplace, then install plugins via /plugin and navigating to the installed marketplace.
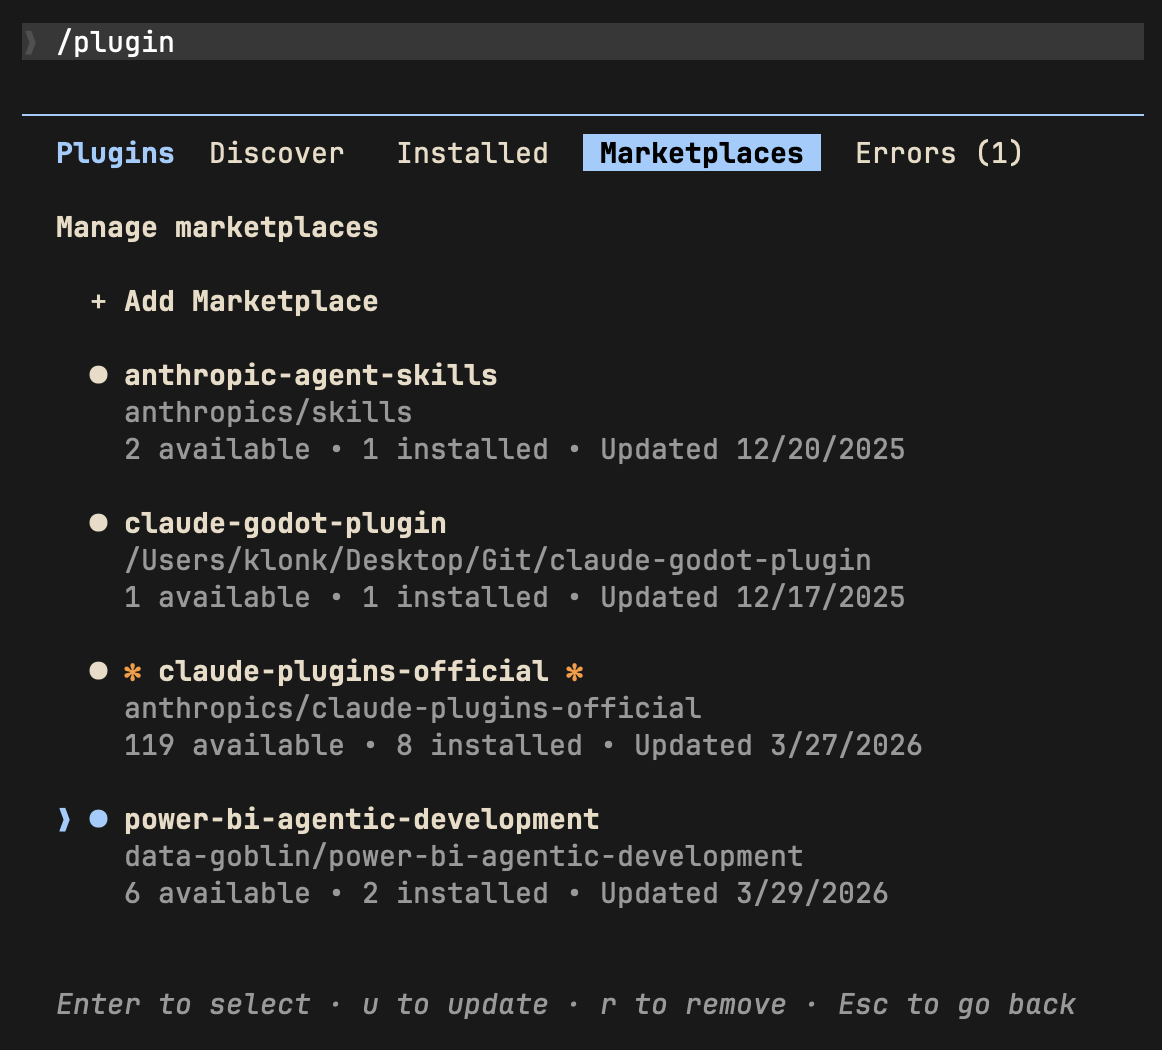 | 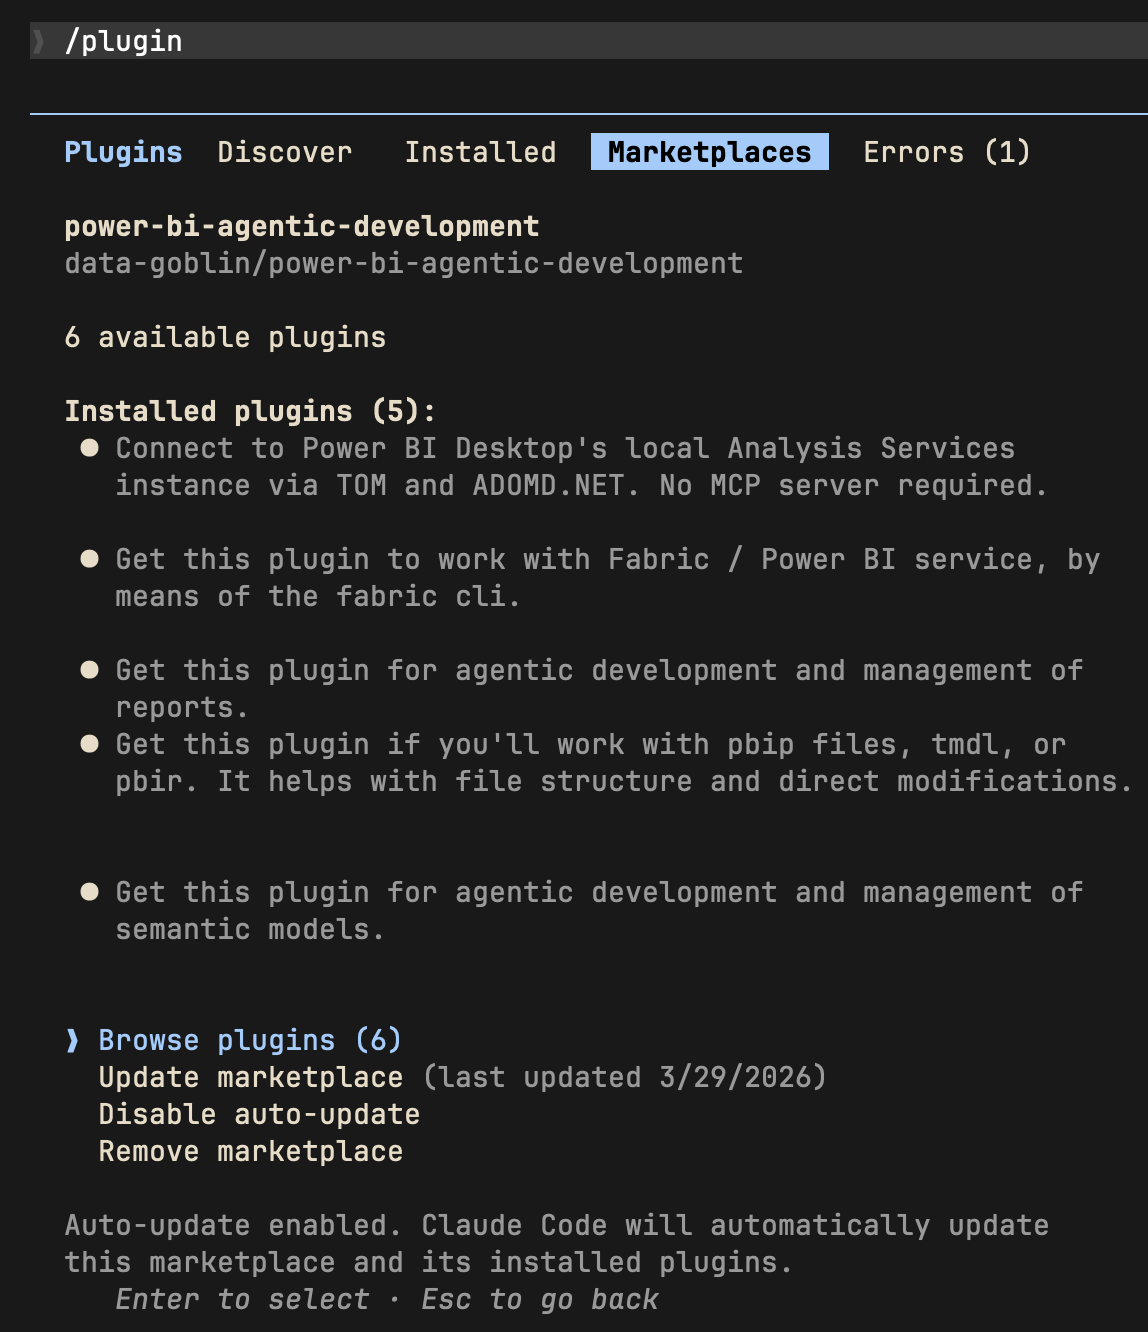 |
| Install plugins from the marketplace | Enable marketplace auto-update |
Alternative; add plugins via command line:
claude plugin install tabular-editor@power-bi-agentic-development
claude plugin install pbi-desktop@power-bi-agentic-development
claude plugin install semantic-models@power-bi-agentic-development
claude plugin install reports@power-bi-agentic-development
claude plugin install pbip@power-bi-agentic-development
claude plugin install fabric-cli@power-bi-agentic-development
The standalone Copilot CLI supports plugin installation from GitHub repos. Copilot CLI reads the same .claude-plugin/marketplace.json manifest this repo uses, so the marketplace and child-plugin layout works without modification.
TMDL files have a problem with repository-relative paths over 260 characters. Windows' legacy MAX_PATH blocks git clone from writing them unless long path support is enabled at both the OS and git level. Without this, copilot plugin install aborts with Filename too long.
Check useful-stuff/agent-scripts/enable-windows-longpaths.ps1 as an example of a script you can run from an elevated ps environment to enable long paths; there are other routes to do this that you can find online, too... just ask Copilot. A reboot is recommended after the registry change. This is a Windows OS limitation, documented at Maximum Path Length Limitation.
See also the below git config command:
git config --system core.longpaths true
npx claudepluginhub data-goblin/power-bi-agentic-development --plugin reportsAudit tenant settings, governance, security groups, and Fabric admin state.
 data-goblin
Inspect, query, and transform lakehouse data with Spark, Livy, and DuckDB.
data-goblinAuthor, validate, publish, and test print-ready paginated reports.
data-goblinBuild Deneb, Python, R, SVG, and pbiviz custom visuals for Power BI.
data-goblinSet up, audit, and improve your agentic Power BI development workspace.
data-goblinInspect and query the live Power BI Desktop model via TOM and ADOMD.NET.
data-goblinDeveloper skills for authoring Microsoft Power BI solutions.
 microsoft
Complete Power BI expertise for report development, DAX, TMDL, Power Query M, REST API automation, PBIR/PBIP programmatic creation, Tabular Editor, TOM/.NET SDK, semantic models, deployment pipelines, CI/CD, Fabric/Direct Lake integration, performance optimization, and embedded analytics. Covers everything from data modeling to enterprise governance.
 JosiahSiegel
Transform data into compelling narratives using visualization, context, and persuasive structure. Use when presenting analytics to stakeholders, creating data reports, or building executive presentations.
 wshobson
Connect to Looker and interact with your data using LookML.
 gemini-cli-extensions
Claude Code integration for Microsoft Fabric CLI, enabling AI-assisted data and analytics workflows.
data-goblin'%20stop-opacity%3D'0.16'%2F%3E%3Cstop%20offset%3D'1'%20stop-color%3D'rgb(200%2C90%2C60)'%20stop-opacity%3D'0.03'%2F%3E%3C%2FlinearGradient%3E%3C%2Fdefs%3E%3Crect%20width%3D'320'%20height%3D'200'%20fill%3D'url(%23g)'%2F%3E%3Ccircle%20cx%3D'250'%20cy%3D'56'%20r%3D'92'%20fill%3D'rgb(200%2C90%2C60)'%20fill-opacity%3D'0.06'%2F%3E%3Ccircle%20cx%3D'64'%20cy%3D'172'%20r%3D'58'%20fill%3D'rgb(200%2C90%2C60)'%20fill-opacity%3D'0.05'%2F%3E%3C%2Fsvg%3E)