Stats
Actions
Available In
Tags
By simple10
Monitor Claude Code agents in real time with a dashboard, start/stop/restart the observability server, tail logs, and diagnose issues across Docker, CLI, and MCP interfaces
Matches all tools
Hooks run on every tool call, not just specific ones
Admin access level
Server config contains admin-level keywords
Own this plugin?
Verify ownership to unlock analytics, metadata editing, and a verified badge. GitHub access is read-only (username + org membership).
Sign in to claimOwn this plugin?
Verify ownership to unlock analytics, metadata editing, and a verified badge. GitHub access is read-only (username + org membership).
Sign in to claimBased on adoption, maintenance, documentation, and repository signals. Not a security audit or endorsement.
Real-time observability dashboard for Claude Code and Codex agents.
Includes powerful filtering, searching, and visualization of multi-agent sessions with full replay and token usage stats.
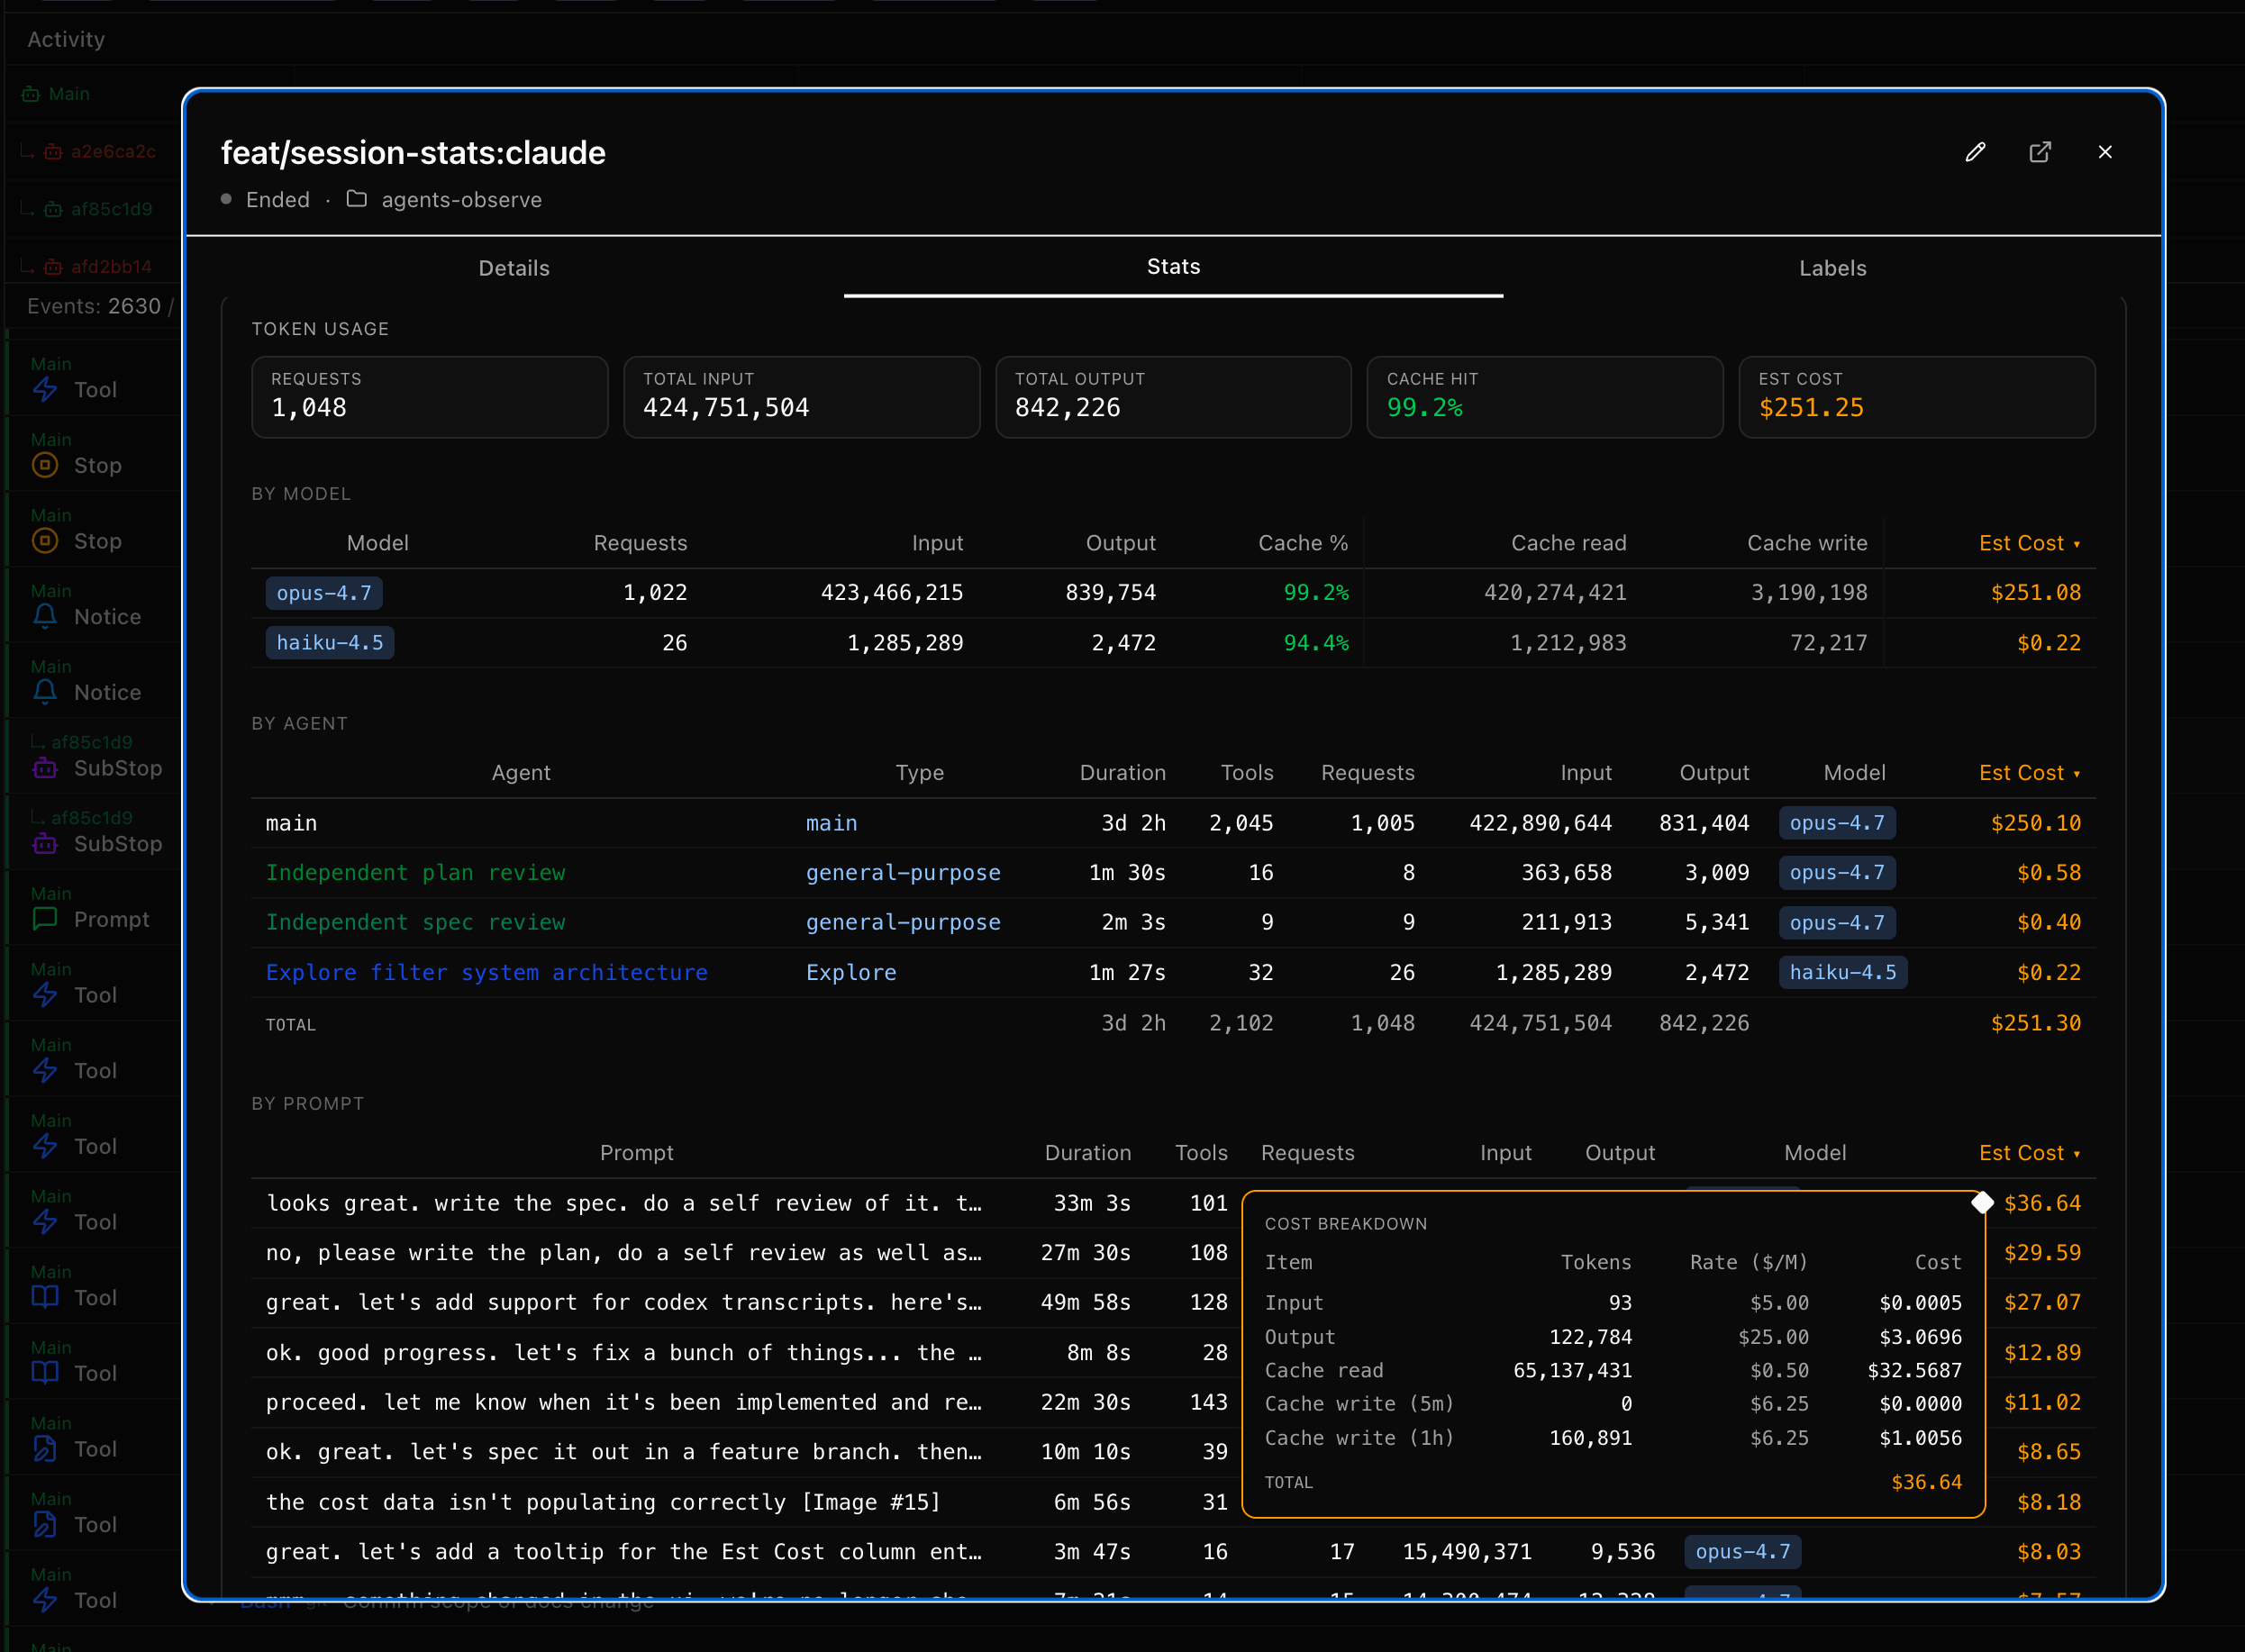
Version 0.9.7 adds token usage and cost breakdowns in session stats.
Install as a claude code plugin:
# Add this repo as a marketplace
claude plugin marketplace add simple10/agents-observe

# Install the plugin
claude plugin install agents-observe

# Then just run claude
# The plugin will auto start the MCP server and capture events
claude

# Use the /observe skill in claude to check status, restart the server, etc.
> /observe status
> /observe debug
> /observe logs
> /observe restart

# Open the dashboard UI in a browser
open http://localhost:4981
Default dashboard URL: http://localhost:4981
By default, the SQLite DB and logs live under:
$CLAUDE_PLUGIN_DATA when running as a Claude plugin. Claude Code names this dir
<plugin>-<marketplace> — so a marketplace install lands at
~/.claude/plugins/data/agents-observe-agents-observe/, and a --plugin-dir
install lands at ~/.claude/plugins/data/agents-observe-inline/.~/.agents-observe/ when running outside Claude (Codex, manual CLI, dev).The DB sits at <root>/data/observe.db, logs at <root>/logs/.
To pin the location somewhere else — e.g. an external volume — set
AGENTS_OBSERVE_LOCAL_DATA_ROOT in your ~/.claude/settings.json:
  // ~/.claude/settings.json
  "env": {
    "AGENTS_OBSERVE_LOCAL_DATA_ROOT": "/path/to/your/dir"
  },
Upgrading the plugin preserves your DB automatically. If you're upgrading
from a pre-fix version (≤ 0.9.8) the server scans for a DB under the old
version-scoped install dir on first start and copies it into the stable
location. See <root>/data/.migrated-from.json for the record.
nodehooks.sh for fast fire and forget event loggingIf docker, node, or bash are not installed on your host, the plugin will fail to properly load.
Use the /observe debug claude command to help troubleshoot and fix installation issues.
| Skill | Description |
|---|---|
/observe view | Open the current session in the dashboard |
/observe stats | Open the current session's stats modal in the dashboard |
/observe | Open the dashboard URL and check if the server is running |
/observe status | Show server health, version, runtime, and config details |
/observe start | Start the server |
/observe stop | Stop the server |
/observe restart | Restart the MCP server |
/observe logs | Show recent Docker container logs |
/observe debug | Diagnose server issues (health, docker logs, mcp.log, cli.log) |
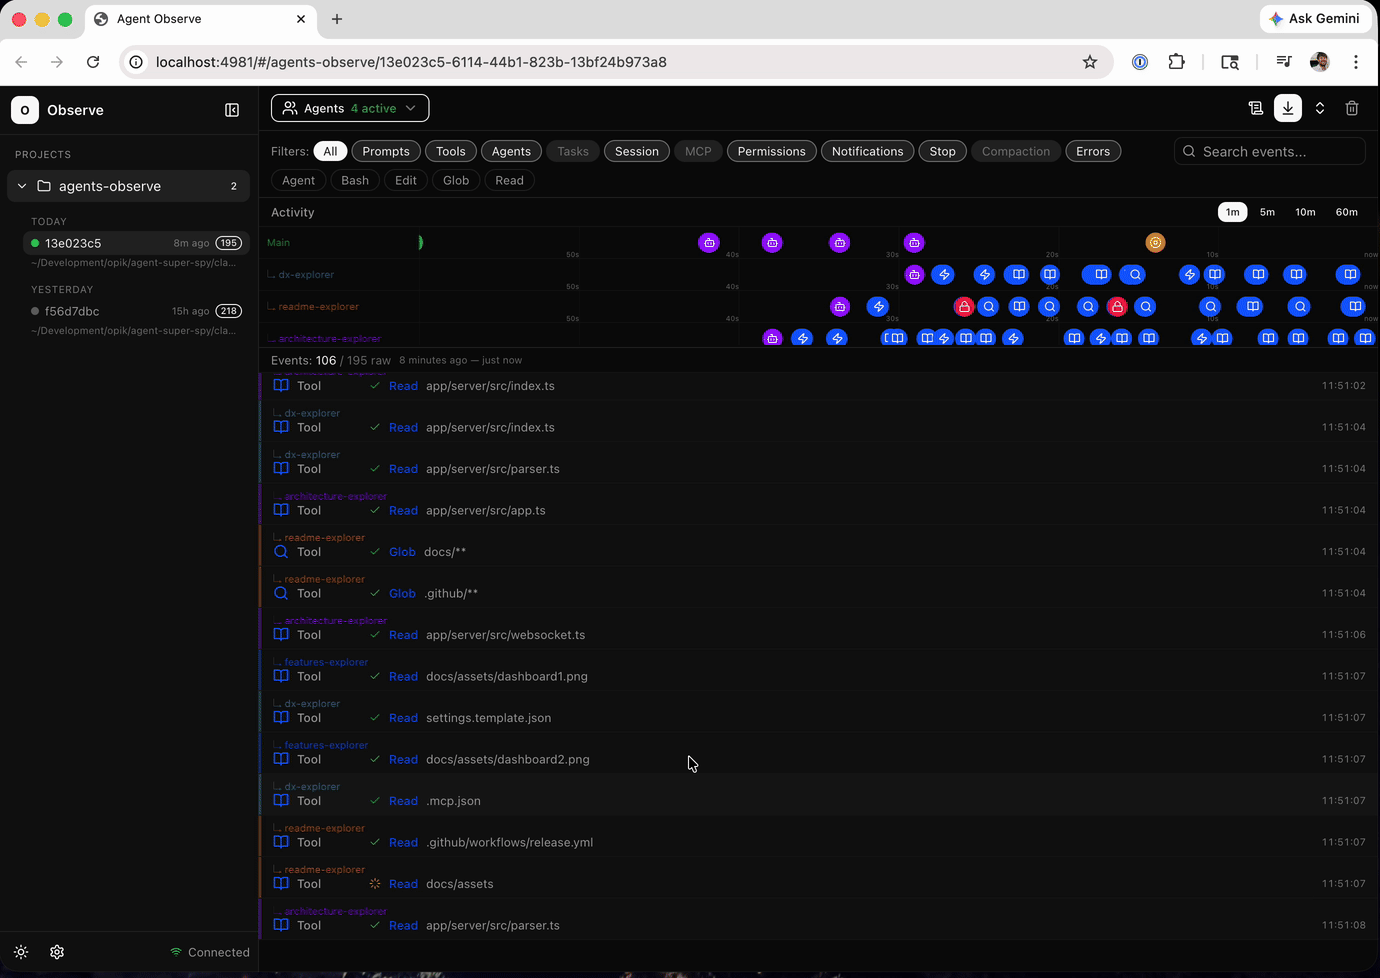
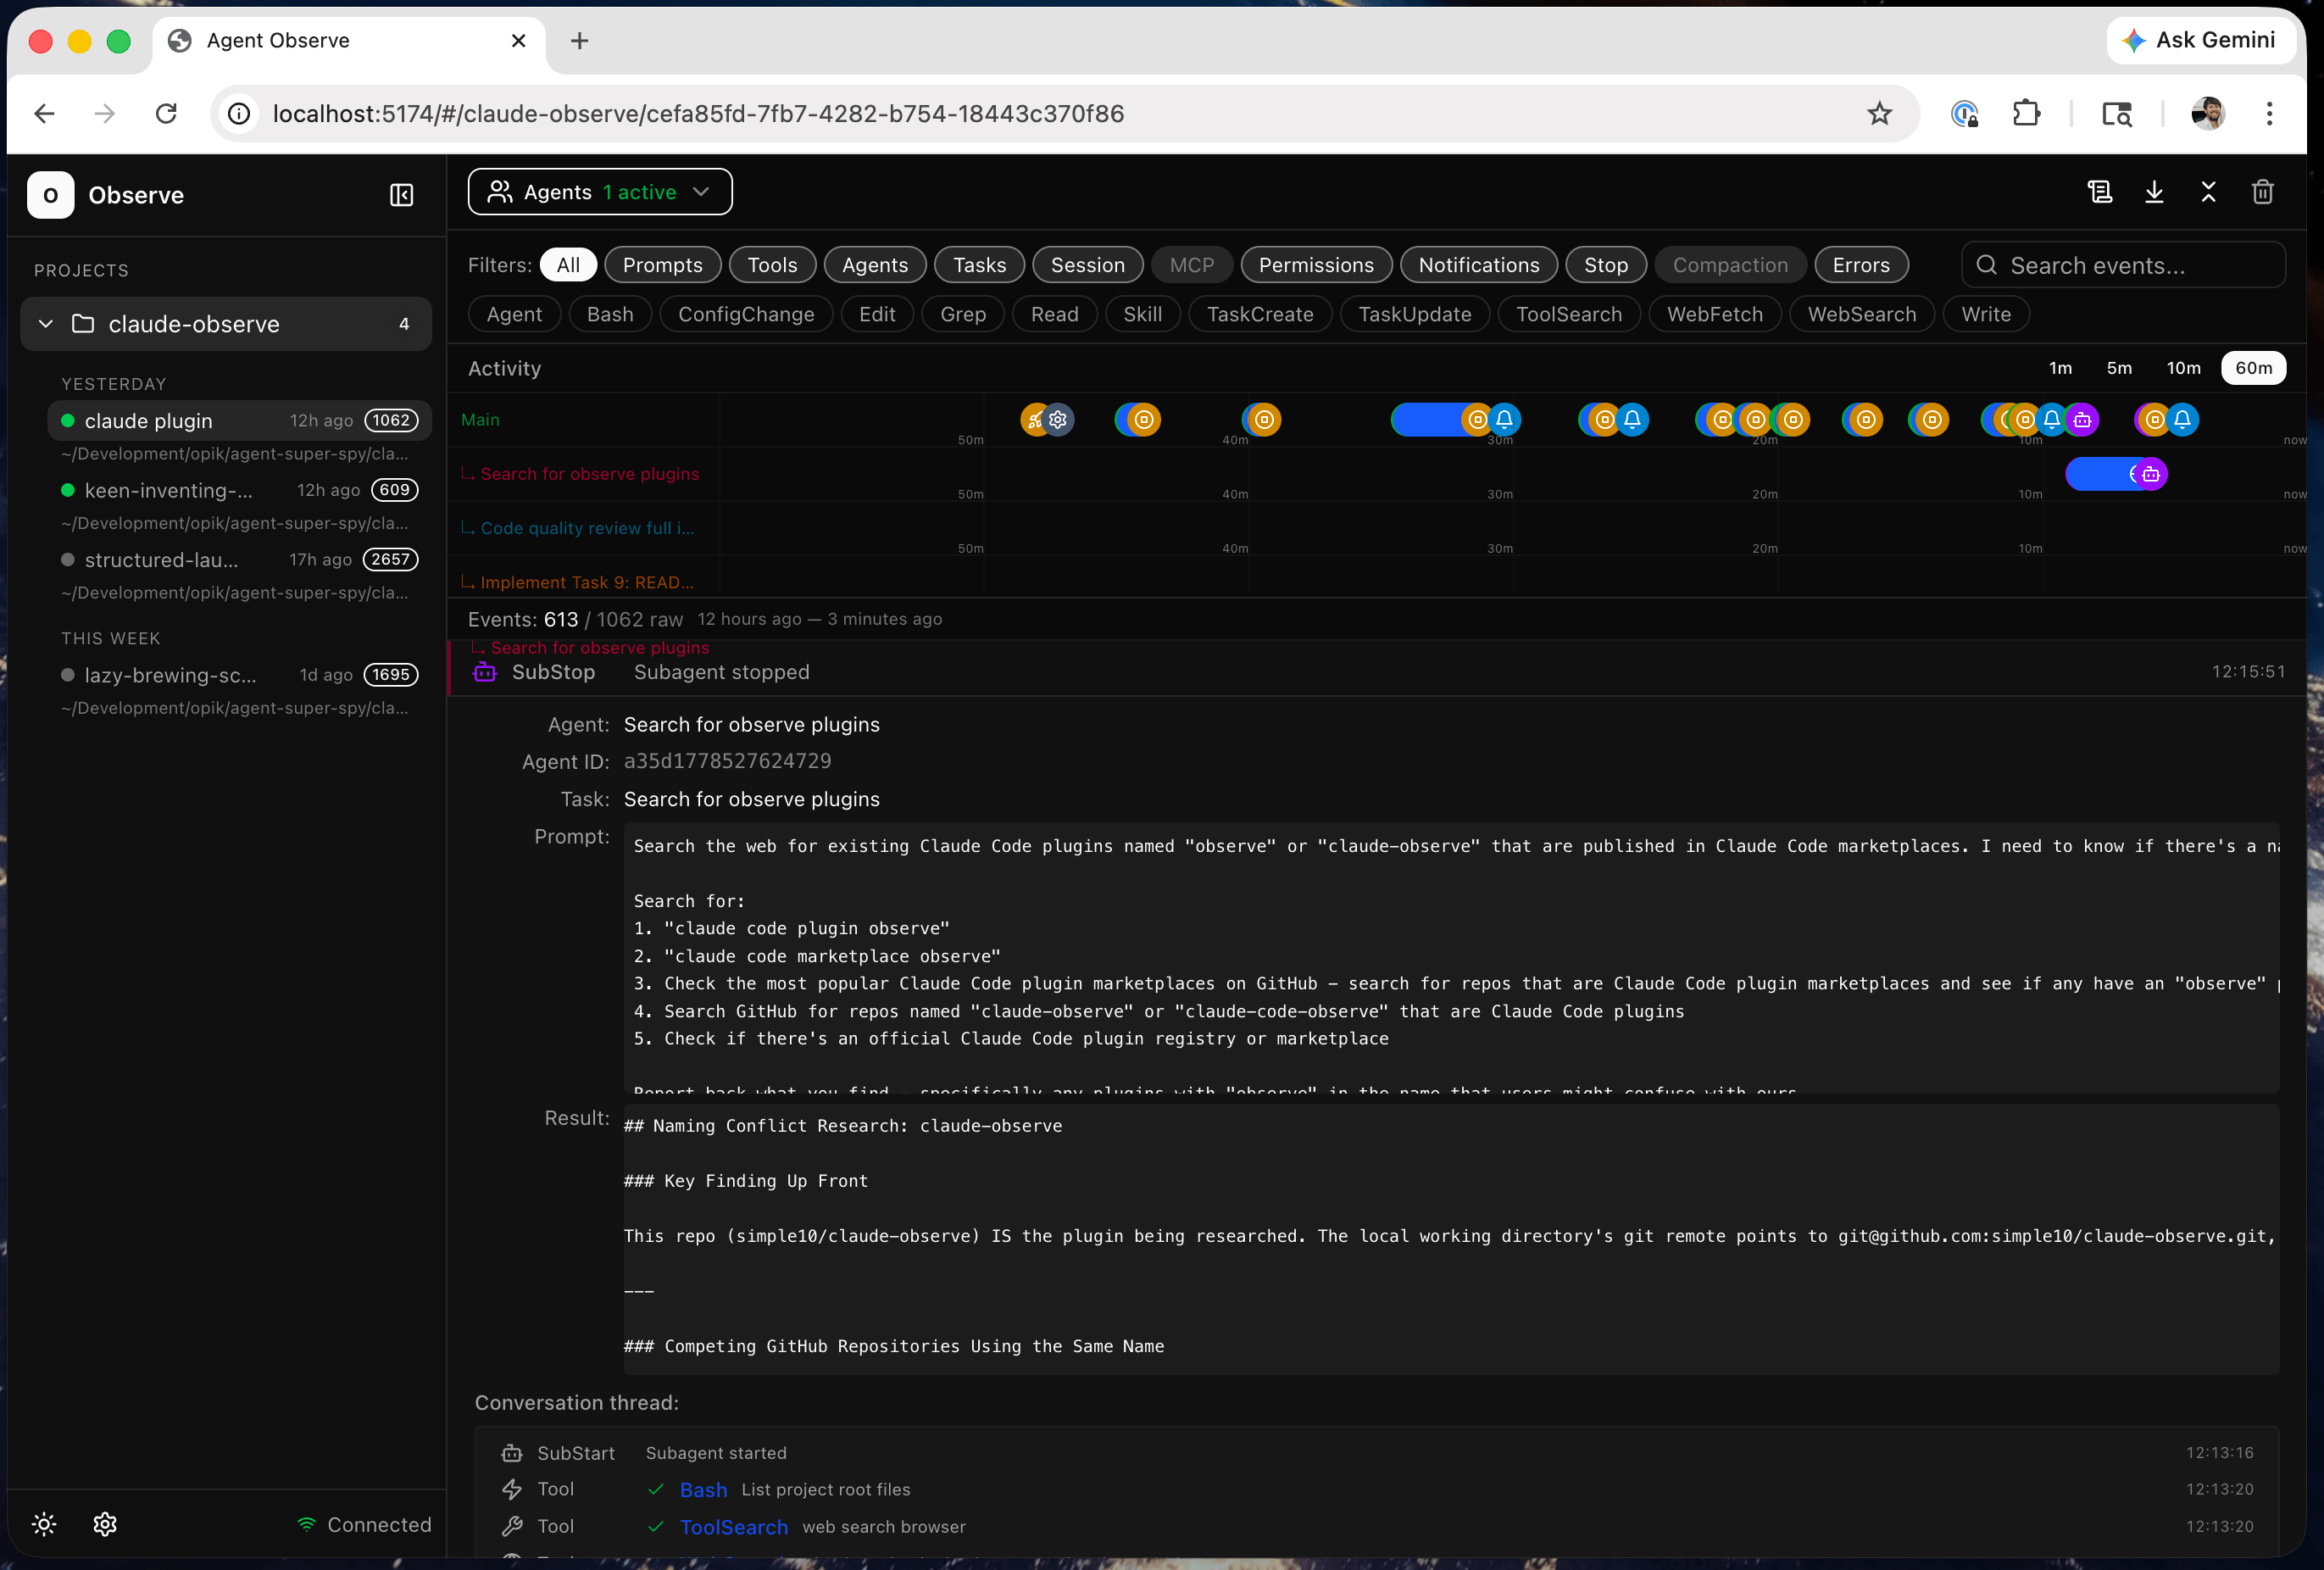
When Claude Code runs autonomously — spawning subagents, calling tools, reading files, executing commands — you have no visibility into what's actually happening. The terminal shows a fraction of the activity. Subagents are invisible. Tool calls blur together. And when something goes wrong three agents deep in a parallel execution, you're left reading through logs after the fact.
Agents Observe captures every hook event as it happens and streams it to a live dashboard. You see exactly what each agent is doing, which tools it's calling, what files it's touching, and how subagents relate to their parents. In real time.
This matters because:
npx claudepluginhub simple10/agents-observe --plugin agents-observeObservability platform for Claude Code and Agent SDK — monitor, debug, and control AI coding agents
Mission Control for Claude Code — auto-starts a web dashboard, provides 90 MCP tools (sessions, stats, live monitoring, projects, teams, insights, coaching, and more), and adds 9 skills including /session-recap, /daily-cost, /standup, /coaching, /insights, and /team-status.
LLM observability tooling for agent development and Claude Code
Agent dashboard TUI — tracks AI agent state via hooks for the fleet CLI
Reports Claude Code agent status to OpenUI for real-time status display
Multi-agent tmux dashboard with skills, hooks, and workflow automation