Stats
Actions
Available In
Tags
By jimkeecn
Capture all 26 Claude Code lifecycle events as Node.js commands, enabling OpenTelemetry-based analytics and external tooling to observe every session state change without bash or file writes.
Matches all tools
Hooks run on every tool call, not just specific ones
Own this plugin?
Verify ownership to unlock analytics, metadata editing, and a verified badge. GitHub access is read-only (username + org membership).
Sign in to claimOwn this plugin?
Verify ownership to unlock analytics, metadata editing, and a verified badge. GitHub access is read-only (username + org membership).
Sign in to claimBased on adoption, maintenance, documentation, and repository signals. Not a security audit or endorsement.
English | 中文 | 日本語 | Français | Deutsch
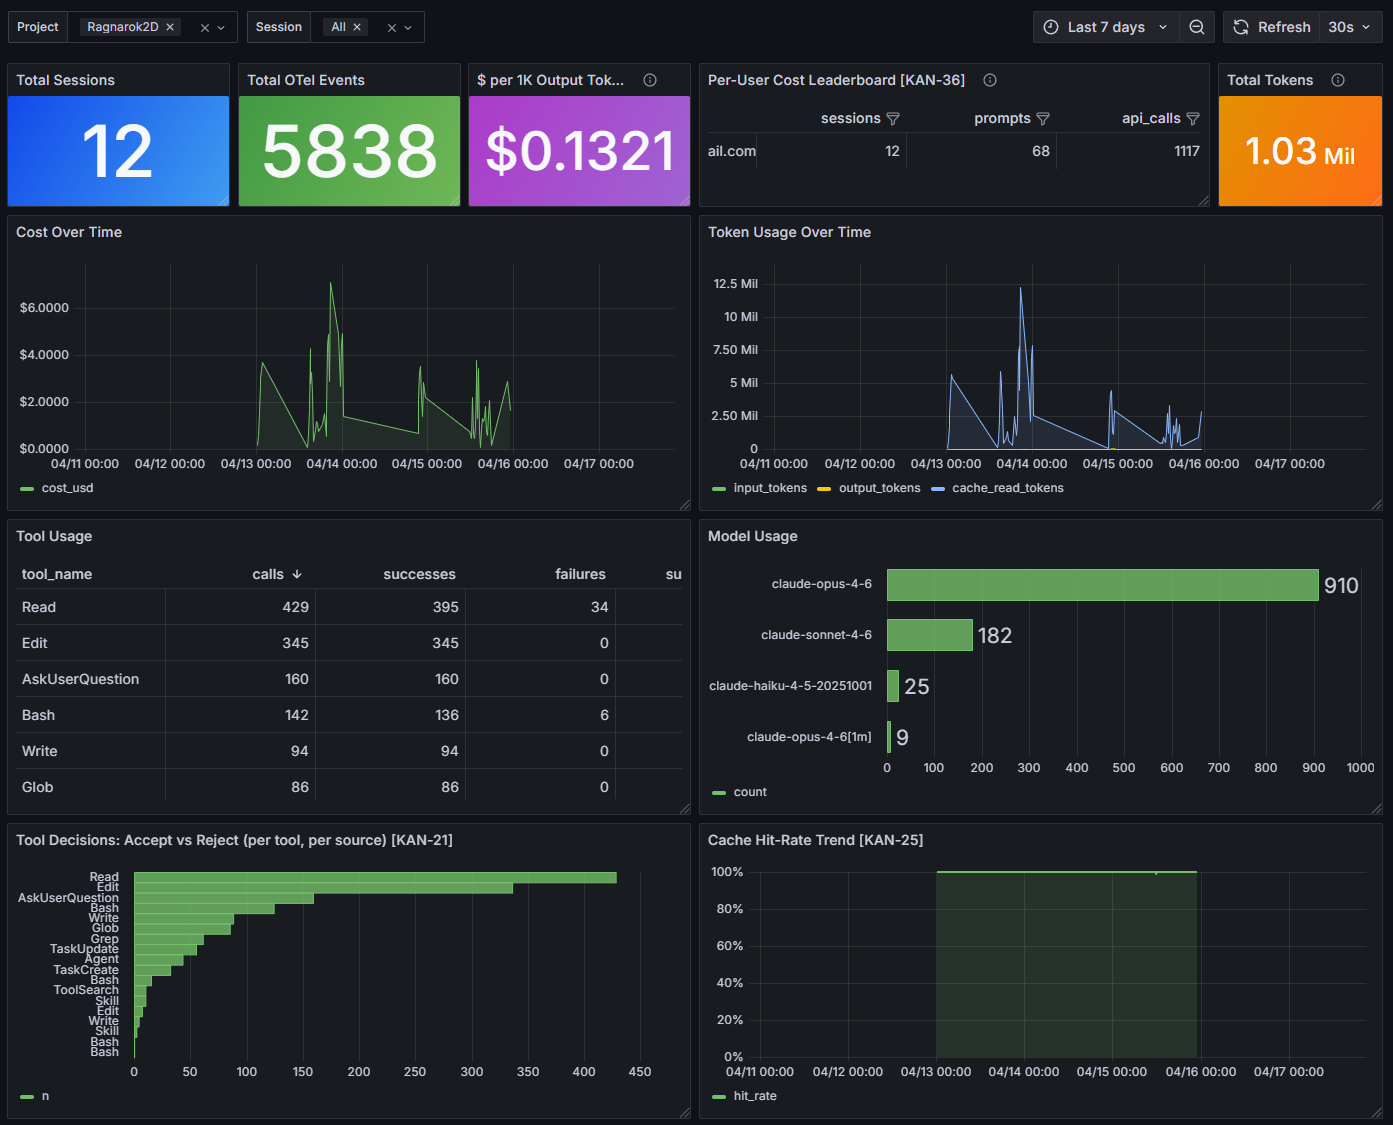
Local analytics dashboard for Claude Code
Track costs, tokens, tool usage, and session activity across all your projects. Zero cloud dependencies. Your data stays on your machine.
![]()
Installation · Features · Updating · Team Use · Changelog
git clone https://github.com/jimkeecn/Claudalytics.git
cd Claudalytics
claude
In Claude Code, run:
/preflight-check
This verifies that all required host ports are free before you start Docker. The hooks server and OTel exporter are tightly coupled to these port numbers — if any port is in use, free it (the skill prints the process and the terminate command). Do not remap Claudalytics' ports.
Required host ports
| Port | Purpose |
|---|---|
| 13000 | Grafana UI |
| 4317 | OTel collector (gRPC receiver) |
| 4318 | OTel collector (HTTP receiver) |
| 4319 | Hooks server |
| 8123 | ClickHouse HTTP |
| 9000 | ClickHouse native TCP |
| 13133 | OTel collector health endpoint |
cd docker-stack
docker compose up -d --build
Wait ~30 seconds. Then go back to the repo root:
cd ..
Run /validate-infra to verify all 4 containers, tables, and materialized views are healthy.
Add the Claudalytics marketplace and install the plugin in any project:
/plugin marketplace add jimkeecn/Claudalytics
/plugin install claudalytics@claudalytics
Pin to a specific release:
/plugin marketplace add jimkeecn/[email protected]
Local development — if you're iterating on the plugin code itself, install directly from your local checkout instead:
/install-plugin /full/path/to/Claudalytics/plugin
/init-claudalytics
Follow the prompts — confirm your project name, and the skill configures everything.
Restart your session for telemetry to take effect, then open:
http://localhost:13000 (admin / admin)
Navigate to: Home > Dashboards > Claudalytics > Claudalytics - OTel Overview
That's it. Data starts flowing immediately.
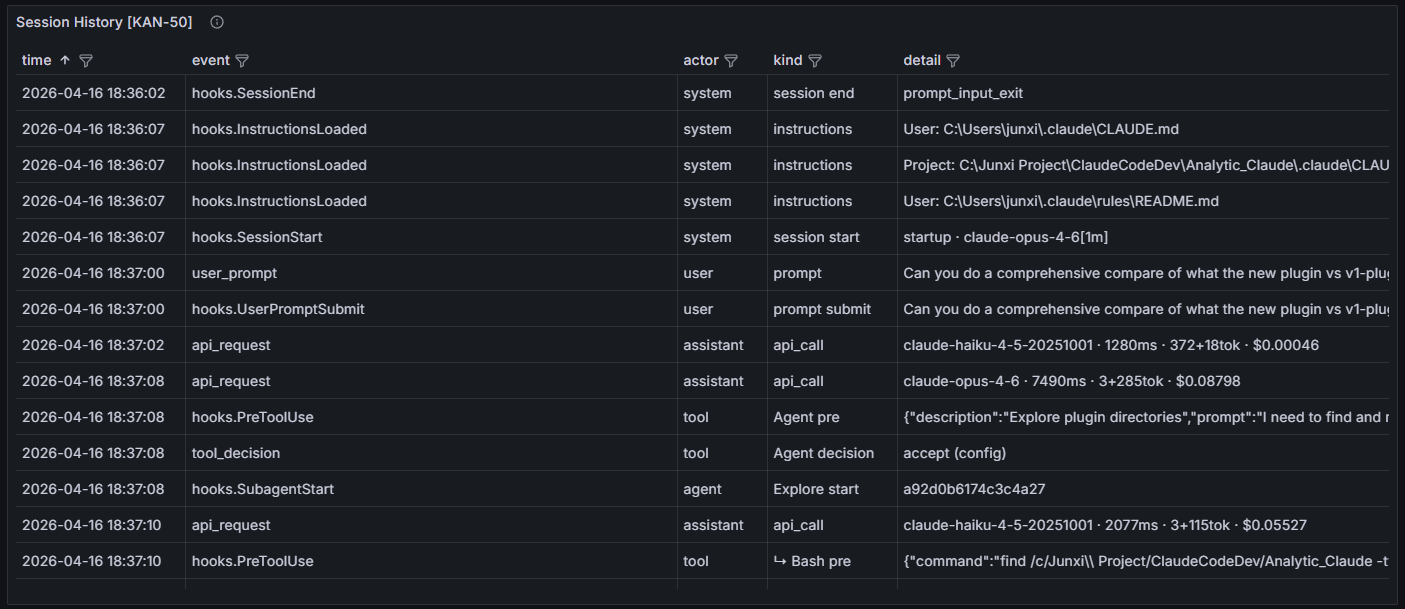
Every action in a single view — prompts, API calls, tool executions, subagent dispatches, permission requests, compaction events — merged from OTel and hooks into one chronological timeline.
Track spending across sessions, models, and projects. See cost per 1K output tokens, token usage over time, cache hit rates, and identify your most expensive sessions and prompts.
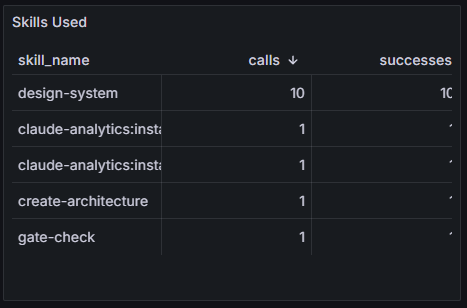
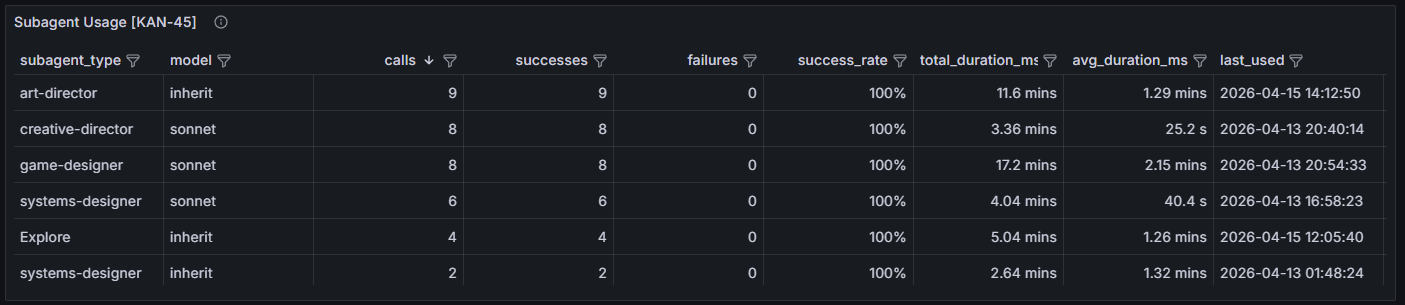
Monitor which skills and subagents Claude uses, their success rates, duration, and model selection. Spot inefficiencies — high re-invocation rates mean the first attempt likely failed.
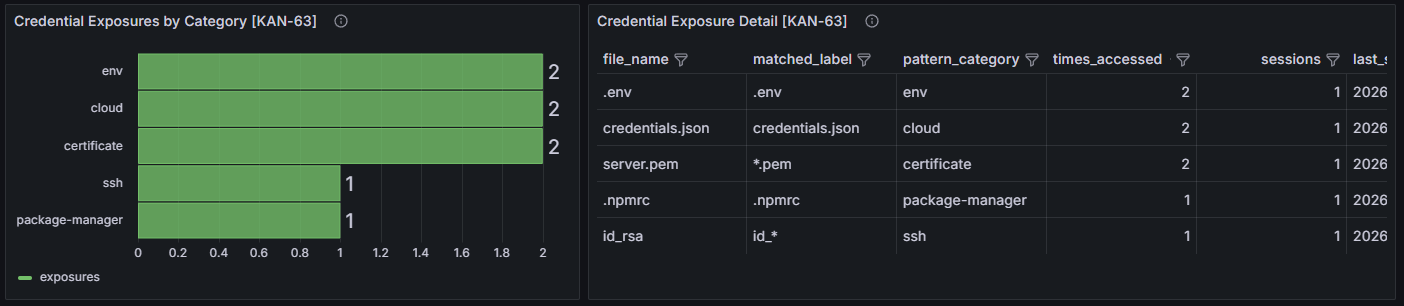
Automatically detects when Claude reads sensitive files — .env, AWS credentials, SSH keys, certificates, database configs — across 38 patterns in 13 categories. No configuration needed. Powered by a ClickHouse materialized view that pattern-matches in real-time.
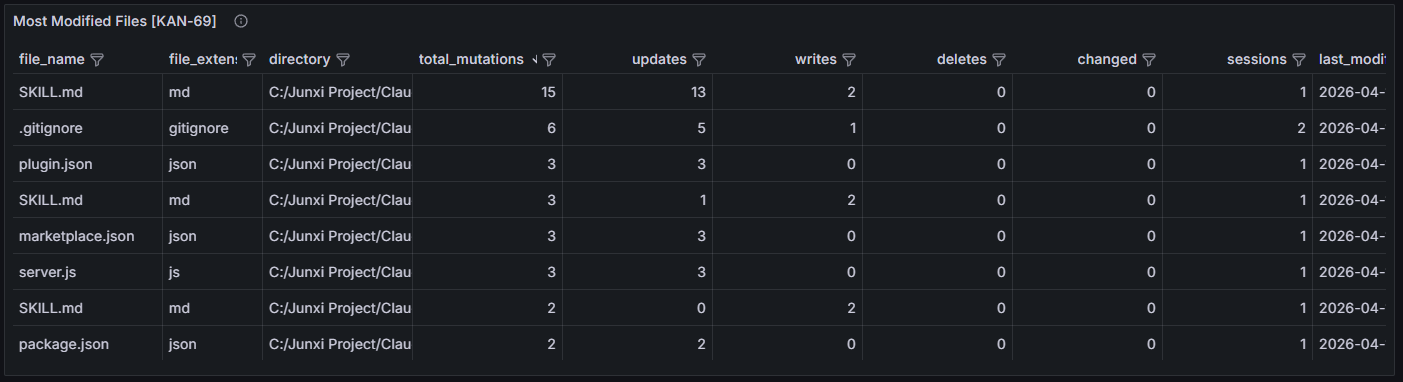
Every file Claude edits, writes, or deletes is tracked with action type, file extension, and directory. See which files get modified most and spot unexpected deletions.
Tool calls that were denied or cancelled are automatically detected by tracking PreToolUse events that never received a PostToolUse response. Useful for auditing what Claude tried to do but was stopped from doing.
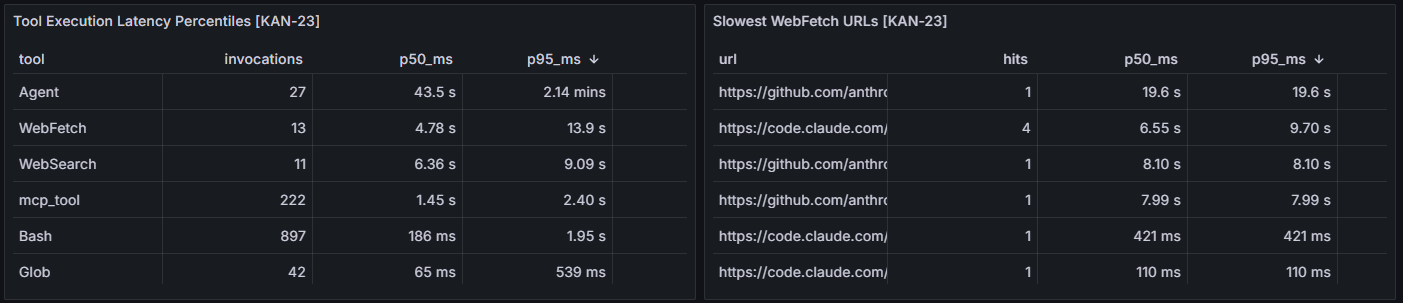
Identify performance bottlenecks — which tools are slowest at p50/p95, and which URLs take the longest to fetch.
npx claudepluginhub jimkeecn/claudalytics --plugin claudalyticsTracks Claude Code session usage (tokens, costs, skills, MCP, subagents) and sends data to a self-hosted dashboard.
Mission Control for Claude Code — auto-starts a web dashboard, provides 90 MCP tools (sessions, stats, live monitoring, projects, teams, insights, coaching, and more), and adds 9 skills including /session-recap, /daily-cost, /standup, /coaching, /insights, and /team-status.
Real-time session dashboard for Claude Code — cost tracking, analytics, and smart alerts
Analyze Claude Code session token usage, costs, trends, and anomalies
OpenLit telemetry for Claude Code: sessions, tool calls, edit decisions, and cost rollups.
Visual dashboard for Claude Code harness — usage/token analysis of skills, agents, plugins, hooks, memory, MCP servers, rules, and principles
'%20stop-opacity%3D'0.16'%2F%3E%3Cstop%20offset%3D'1'%20stop-color%3D'rgb(200%2C90%2C60)'%20stop-opacity%3D'0.03'%2F%3E%3C%2FlinearGradient%3E%3C%2Fdefs%3E%3Crect%20width%3D'320'%20height%3D'200'%20fill%3D'url(%23g)'%2F%3E%3Ccircle%20cx%3D'250'%20cy%3D'56'%20r%3D'92'%20fill%3D'rgb(200%2C90%2C60)'%20fill-opacity%3D'0.06'%2F%3E%3Ccircle%20cx%3D'64'%20cy%3D'172'%20r%3D'58'%20fill%3D'rgb(200%2C90%2C60)'%20fill-opacity%3D'0.05'%2F%3E%3C%2Fsvg%3E)